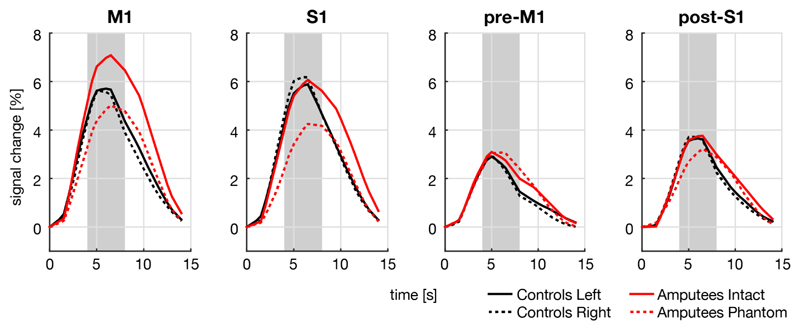
Figure 4. BOLD responses for each of the four ROIs and each hand for controls and amputees.
BOLD responses are expressed in percent signal change, averaged over all trials. Time point 0 indicates the start of the trial. Only S1, there was a significant difference in the BOLD response between the phantom hand of amputees and the intact hand of controls within the interval of 4–8 seconds (indicated by the grey shading).

