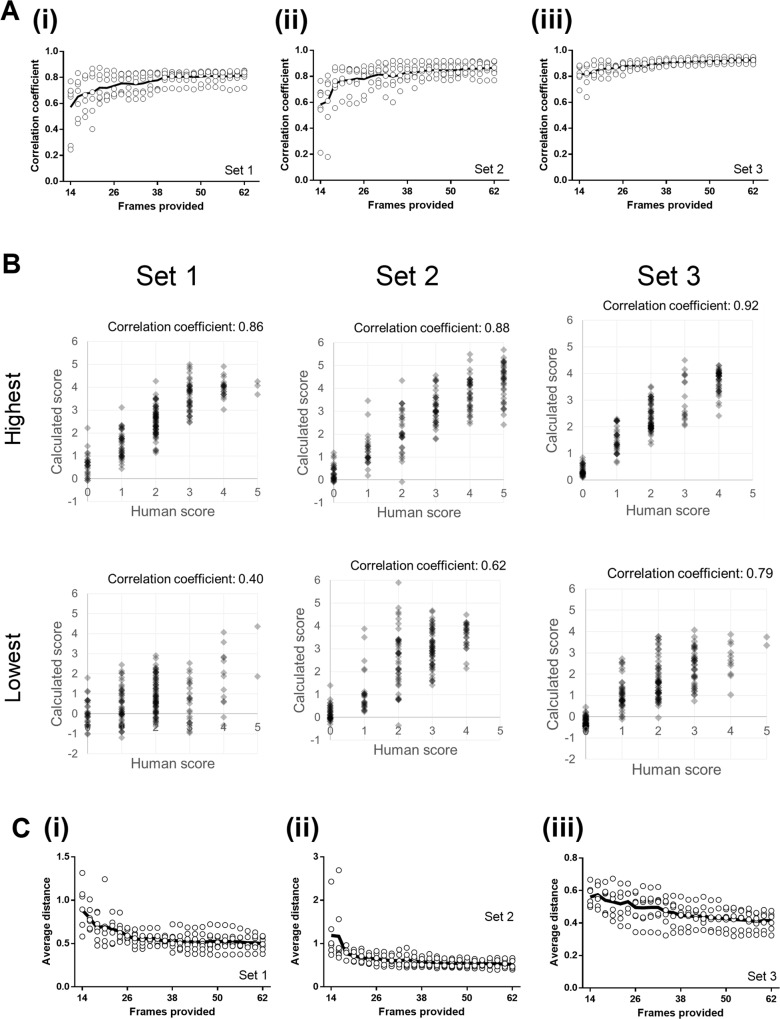
Fig 4. Tify can calculate image scores which correlate well with human scoring.
Users were presented with data sets that contained a variety of image types from separate experiments. Each user was presented with three sets of images, with each set containing 200 frames. Correlation coefficients were calculated for each image by comparing calculated scores with human scores. The software was given an increasing number of frames to use for calculation (horizontal axis). (A) Correlation coefficients derived from the comparison of human to machine scores, excluding the frames provided to the software. Each point represents a single user, and the solid line represents the mean of these values. (B) Example XY plots are shown for the users with the highest and lowest correlation coefficients in each set. The average numerical distance between the human and computed score for each frame was calculated for images in each set. (C) The average distance from each calculated score and the human score in each set decreases as more frames are supplied for the calculation of coefficients. Each point represents results from a single user, and the solid line represents the mean of these values.

