Fig 1.
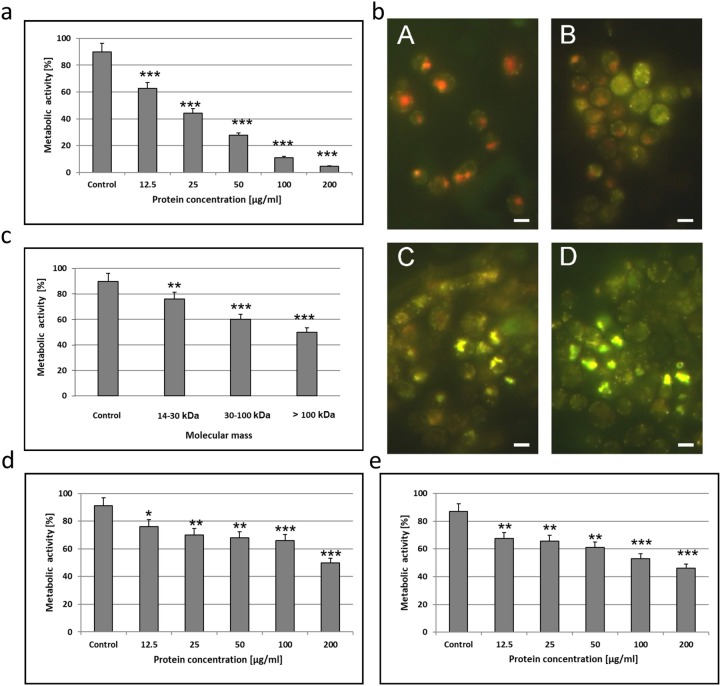
a) Metabolic activity of C. albicans cells (clinical isolate) after incubation for 48 h with the AAF at different protein concentrations. The data are representative of three independent experiments, *p<0.001; b) Metabolic activity of C. albicans cells (clinical isolate) after incubation for 48 h with the AAF observed under the fluorescence microscope; A—C. albicans cells, control culture–(metabolically active cells were clearly marked with fluorescent intravacuolar red structures), B—C. albicans cells after treatment with the AAF at the concentration of 25 μg mL-1 (cells with intact membranes showing low or no metabolic activity exhibited diffused green cytoplasmic fluorescence), C—at the concentration of 50 μg mL-1, D—at the concentration of 100 μg mL-1 (dead cells exhibited extremely bright, diffuse, green-yellow fluorescence and absence of fluorescent intravacuolar bodies). Bars represent 2 μm; c) Metabolic activity of C. albicans cells (clinical isolate) after incubation for 48 h with different molecular mass subfractions at the protein concentration of 100 μg mL-1, d) Metabolic activity of C. albicans ATCC 10231 and e) C. krusei 6258 after incubation for 48 h with the AAF at different protein concentrations. The results were obtained from 3 independent experiments; ***P <0.001, **P<0.01, *P<0.05 compared to the control group.

