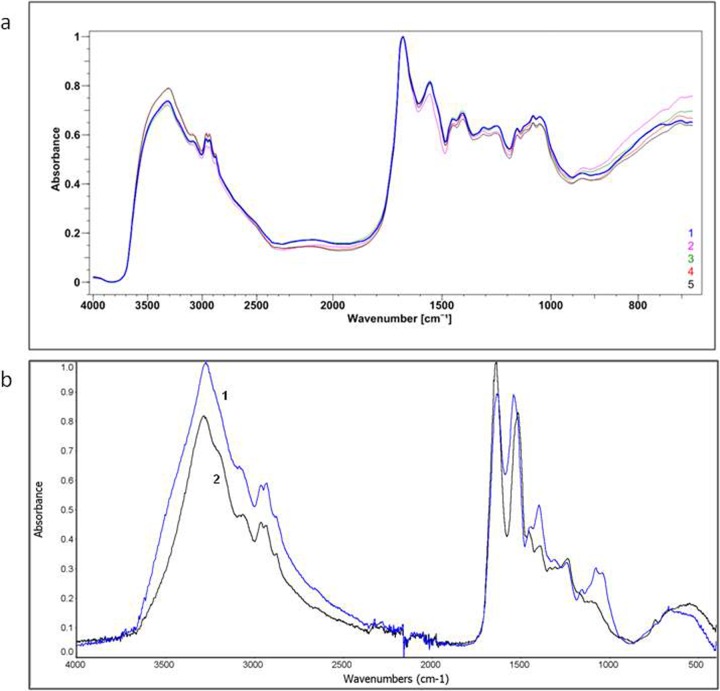
Fig 6.
a) FTIR spectrum of the AAF. Spectra obtained from the 5 analyzed areas (50 x 50 μm). Each spectrum marked with a different color represents another analyzed area. b) ATR—FTIR spectrum of the AAF–(1) and egg white lysozyme–(2). The AAF spectrum showed 82% similarity to the spectrum of egg white lysozyme.

