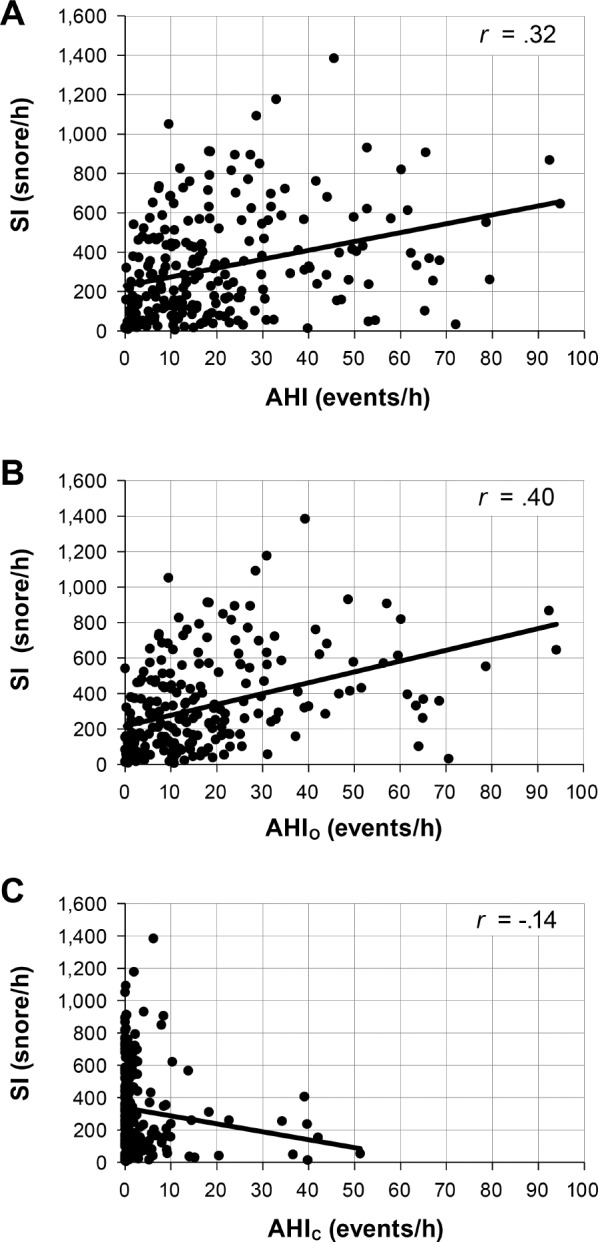
Figure 4. Correlation between AHI and SI.

Relationships between the SI and the overall AHI (A), obstructive AHI (B) and central AHI (C). All three panels contain the entire population. In panel (C), most of the data points are skewed to the left because AHIC for most patients was very low. AHI = apnea-hypopnea index, AHIC = central apnea-hypopnea index, AHIO = obstructive apnea-hypopnea index, SI = snore index.
