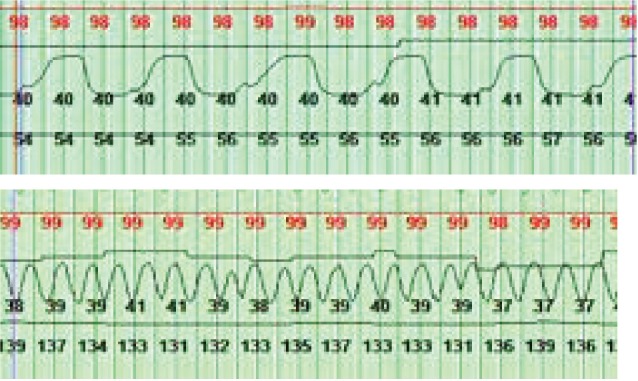
Figure 2. Comparison of ETCO2 tracings.

Top: ETCO2 tracing of a 16-year-old. Bottom: ETCO2 tracing of a study participant. Top tracing shows plateauing of the wave form, barely seen in the newborn ETCO2 tracing. ETCO2 = end-tidal carbon dioxide.

Top: ETCO2 tracing of a 16-year-old. Bottom: ETCO2 tracing of a study participant. Top tracing shows plateauing of the wave form, barely seen in the newborn ETCO2 tracing. ETCO2 = end-tidal carbon dioxide.