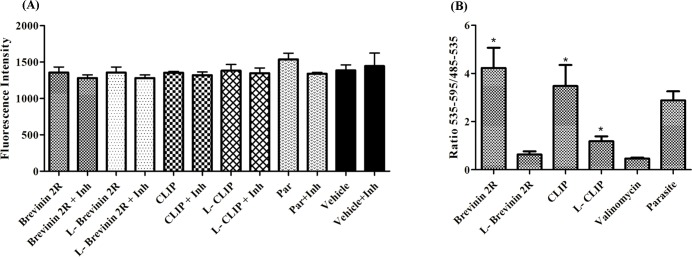
Fig 7.
(A) Active caspase detection in L. major promastigotes exposed to peptides. Changes in the fluorescence intensity in the presence or absence of caspase inhibitors were studied. Inh: inhibitor. (B) Ratio of red to green fluorescence zone for mitochondrial electrical potential detection. Stars indicates the significant difference in compare to valinomycin. *, ** and *** = P value < 0.05, < 0.01 and < 0.001 respectively.

