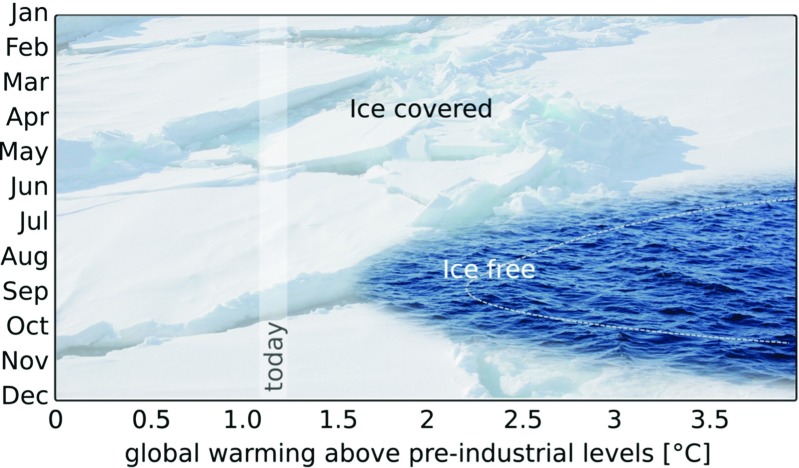
Fig. 1.
Estimated evolution of the Arctic sea-ice cover in response to mean global warming. The figure is based on the extrapolation of the linear relationship between monthly mean Arctic sea-ice area and global-mean temperature provided by [36]. The ice-free range of their high-sensitivity observational record is shown as the water-filled area, while the ice-free range of their low-sensitivity observational record is shown as the dashed line. The estimated warming until 2018 is marked with “today”

