
Figure 3.
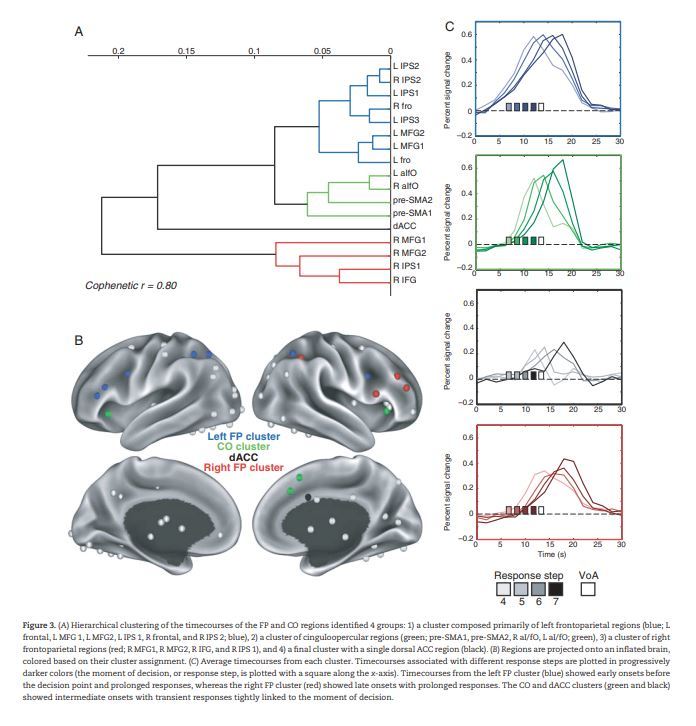
(A) Hierarchical clustering of the timecourses of the FP and CO regions identified 4 groups: 1) a cluster composed primarily of left frontoparietal regions (blue; L frontal, L MFG 1, L MFG2, L IPS 1, R frontal, and R IPS 2; blue), 2) a cluster of cinguloopercular regions (green; pre-SMA1, pre-SMA2, R aI/fO, L aI/fO; green), 3) a cluster of right frontoparietal regions (red; R MFG1, R MFG2, R IFG, and R IPS 1), and 4) a final cluster with a single dorsal ACC region (black). (B) Regions are projected onto an inflated brain, colored based on their cluster assignment. (C) Average timecourses from each cluster. Timecourses associated with different response steps are plotted in progressively darker colors (the moment of decision, or response step, is plotted with a square along the x-axis). Timecourses from the left FP cluster (blue) showed early onsets before the decision point and prolonged responses, whereas the right FP cluster (red) showed late onsets with prolonged responses. The CO and dACC clusters (green and black) showed intermediate onsets with transient responses tightly linked to the moment of decision.