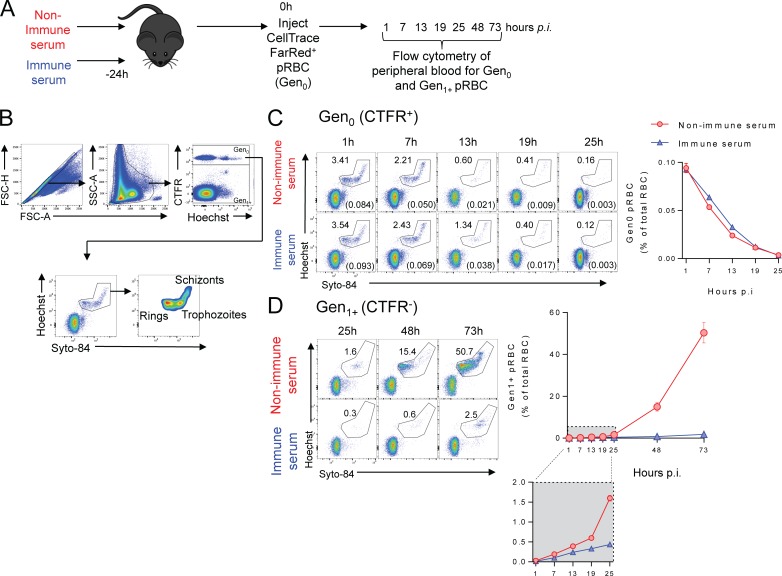
Fig 1. Infection-induced antibodies control Py17XNL parasite growth, not by accelerating pRBC clearance, but by blocking subsequent generations of pRBC.
(A) Schematic showing that mice (n = 5/group) were injected with serum from Py17XNL-immune or non-immune mice 24h prior to challenge with CTFR-labelled Py17XNL-infected pRBCs and the progression of infection tracked by flow cytometry. (B) FACS gating strategy employed to analyse Gen0 and Gen1+ pRBC: forward scatter area and height (FSC-A and FSC-H) used to identify single cells, and side scatter area (SSC-A)/FSC-A used to identify RBCs. CTFR+ RBCs were the initial generation (Gen0), while Hoechst 33342/Syto 84 co-staining identified pRBCs and their life stages. (C) Representative FACS plots for time-course analysis of loss of Gen0 (CTFR+) pRBC, with numbers showing % of CTFR+ RBC containing parasites, also expressed in brackets and the summary graph as a % of total RBC in recipient mice. (D) Representative FACS plots for time-course analysis of Gen1+ (CTFR-) pRBC, and summary graph showing emergence of Gen1+ pRBCs over time. Data are representative of six independent experiments, each showing similar results.

