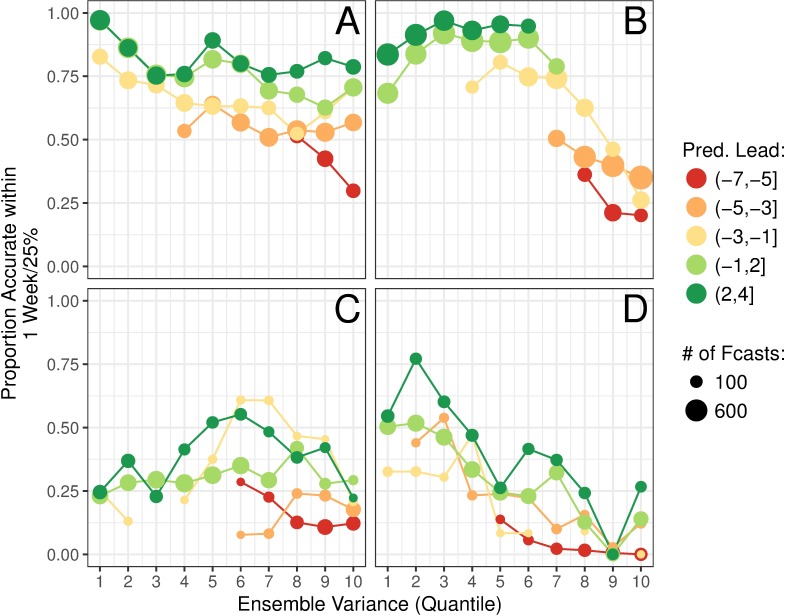
Fig 3. Forecast calibration as the relationship between forecast accuracy and ensemble spread.
The relationship between peak timing (A and C) and peak intensity (B and D) ensemble variance and forecast accuracy by predicted lead week is shown for temperate (A and B) and tropical (C and D) regions. Point size represents how many forecasts are included in the point, and only lead week ranges with at least 100 (A and B) or 10 (C and D) forecasts were included.

