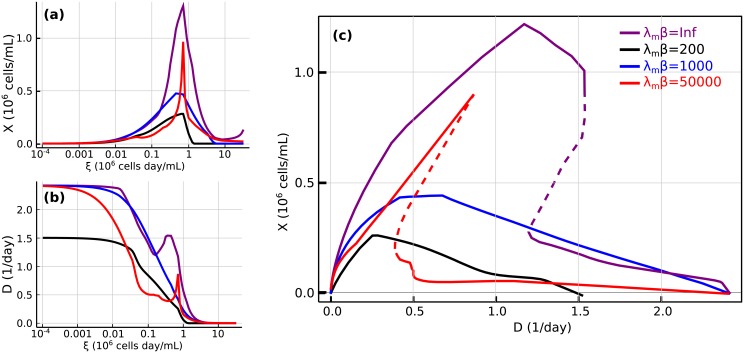
Fig 7. Dilution rate and cell density in steady states of the CHO-K1 metabolic model.
Dilution rate (a) and cell density (b) as functions of ξ. (c) Cell density versus dilution rate. Different curves correspond to different levels of heterogeneity. In (c), the discontinuous line indicates unstable steady states.

