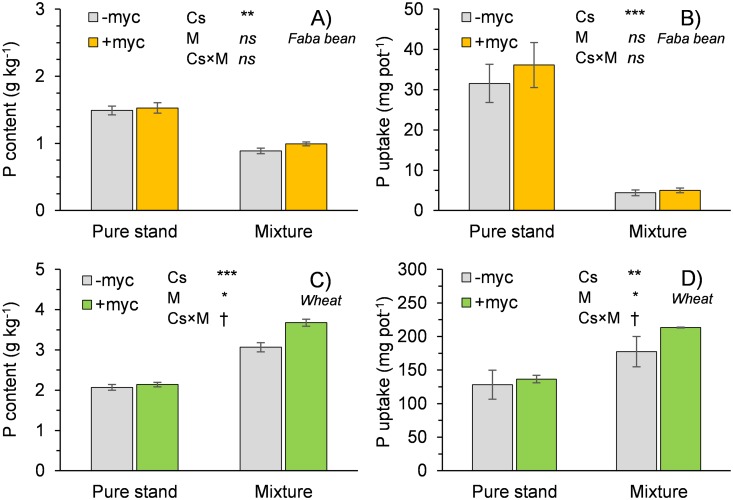
Fig 2.
Phosphorus content and uptake of faba bean (A and B) and wheat (C and D) grown in pure stand and in mixture (values relative to aboveground biomass). Cs, cropping system (pure stand, mixture); M, absence (–myc) or presence (+myc) of arbuscular mycorrhizal fungi (AMF). †, *, **, and *** indicate significant differences at P ≤ 0.10, 0.05, 0.01, and 0.001, respectively; ns indicates nonsignificant differences. Vertical bars indicate standard errors of each mean value (n = 5).

