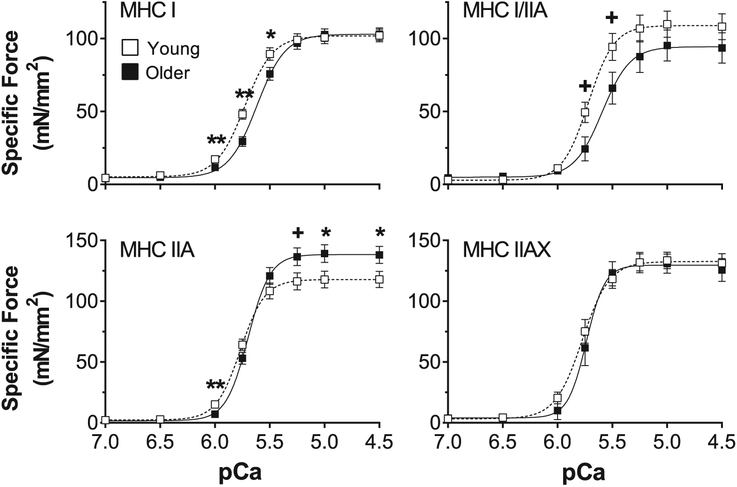
Fig. 3. Absolute pCa-force relationships for young and older adults.
Absolute pCa-force relationship of myosin heavy chain (MHC) I, I/IIA, IIA and IIAX single muscle fibers from young and older adults. The number of fibers analyzed in each group for each fiber type is provided by n in Table 2. Data were acquired at 15 °C and represent means ± SE. Asterisks and plus sign indicate significant difference (*p < 0.05 or **p < 0.01) and trends (+p < 0.10) between young and older groups.

