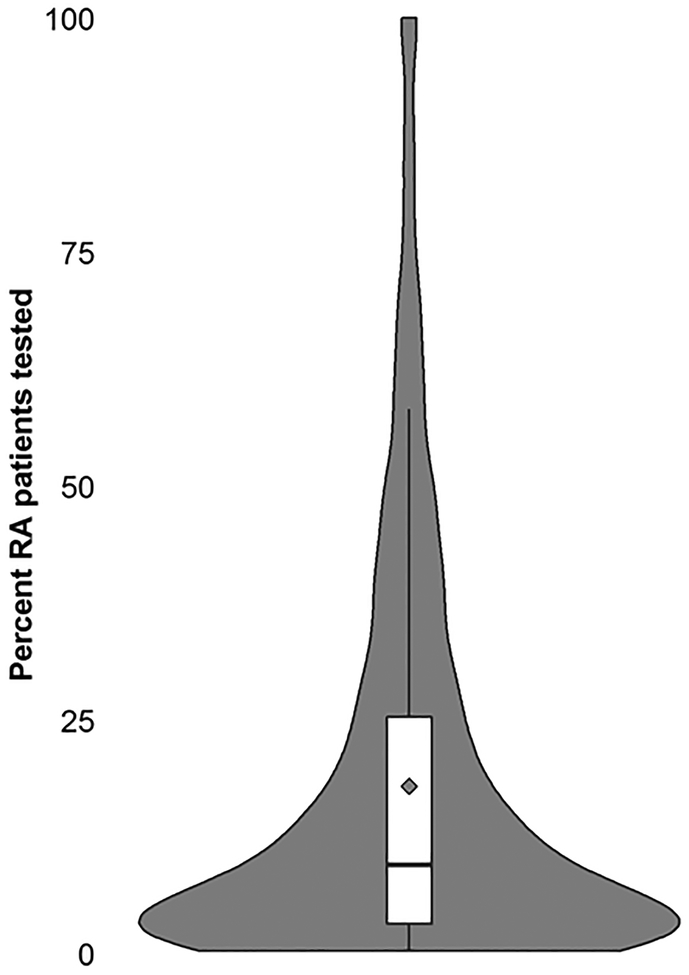
Figure 2.
Distribution of the Proportion of RA Patients Tested at Least Once with the MBDA within each Rheumatologist’s Practice and who had at least 10 RA patients in 2015 (n=1,426)
The solid black horizontal line refers to the proportion of patients tested in the median physician’s practice, and the diamond represents the mean proportion tested.

