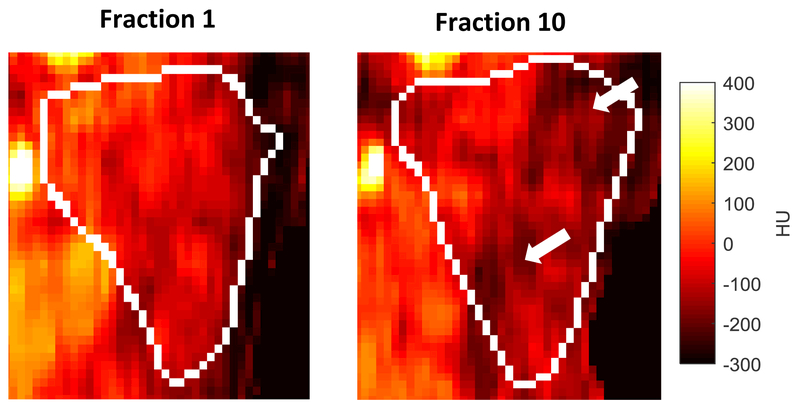
Figure 3:
Example coronal CBCT ipsilateral parotid gland images for a representative patient with 1-year chronic xerostomia on the same color window (−300 to 400 HU). Note loss of high density regions between fraction 1 (left) and fraction 10 (right) which would be in accordance with mean intensity loss

