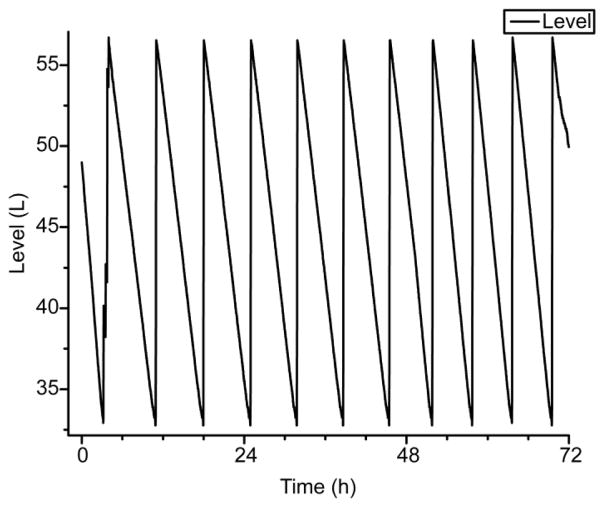
Figure 6. Liquid nitrogen consumption of the heat exchanger.
Plot of the volume of liquid nitrogen bath in the heat exchanger dewar over three days. Positive slopes correspond to fill periods, while negative slopes correspond to heat exchanger boil-off periods. Individual boil-off periods were linearly fit and averaged over the 10 cycles shown above to find an average boil-off rate of 3.8 L/h or 91 L/day. Sample temperatures were maintained below 85 K while the MAS rotor frequency held constant at 5.2 kHz.

