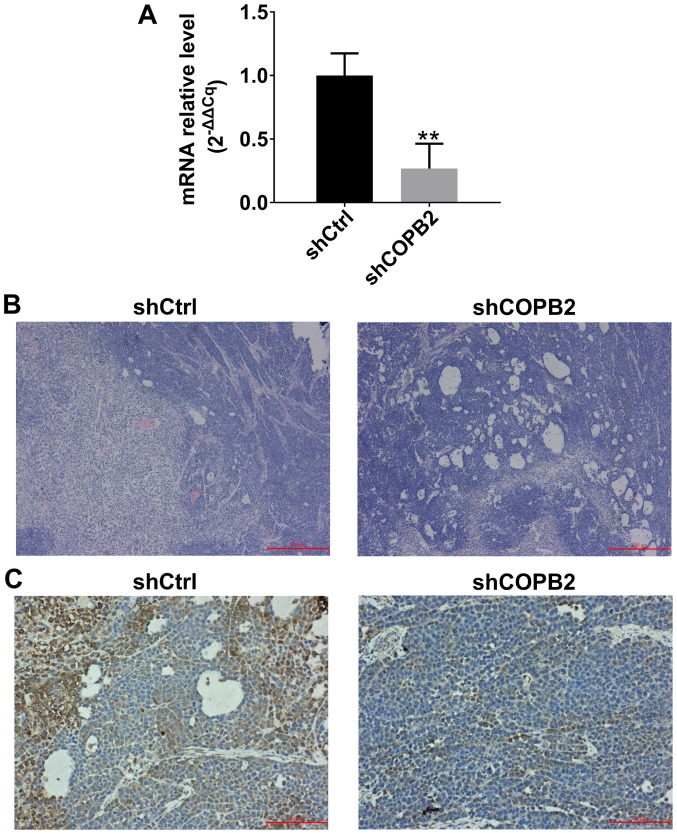
Figure 8.
Detection of COPB2 mRNA and protein expression in xenograft tumor tissues. (A) mRNA expression levels of COPB2 in xenograft tumor tissues from the Lv-shCOPB2 group were significantly lower than in the Lv-shCtrl group (P<0.01). (B) H&E analysis of Lv-shCtrl group tissues indicated that the tumor cells were scattered and varied in size, the nuclei were enlarged, and the staining was intense. A high degree of pathological mitosis was observed in this group, characterized by an abundance of cell nuclei, and a marked number of large tumor cells were detected. In addition, necrotic areas were observed in tumor tissues. H&E staining analysis of tissues from the Lv-shCOPB2 group indicated that the tumor cells were scattered and varied in size. The nuclei were enlarged, and the staining was intense. A high degree of pathological mitosis was also observed in this group; however, only a small number of multinucleated giant cells was identified in the tumor tissues. In addition, a number of small necrotic areas were observed scattered throughout the tumor tissues. Scale bar, 200 µm. (C) Immunohistochemical staining analysis of Lv-shCtrl group tissues demonstrated that COPB2 expression was observed in the cytoplasm of tumor cells and was markedly increased in the cytoplasm of tumor cells surrounding the necrotic regions. Immunohistochemical staining analysis of Lv-shCOPB2 group tissues indicated that COPB2 expression of was increased in the cytoplasm of tumor cells and in the central region of the tumor cell mass. The semi-quantitative score of COPB2 expression in Lv-shCtrl group tissues was moderately positive (++), whereas the semi-quantitative score of COPB2 expression in Lv-shCOPB2 group tissues was slightly positive(+). In conclusion, COPB2 expression in the Lv-shCOPB2 group was markedly reduced compared with in the Lv-shCtrl group. Scale bar, 50 µm. **P<0.01, compared with the Lv-shCtrl group. COPB2, coatomer protein complex subunit β2; H&E, hema-toxylin and eosin; Lv, lentivirus; sh, short hairpin RNA.

