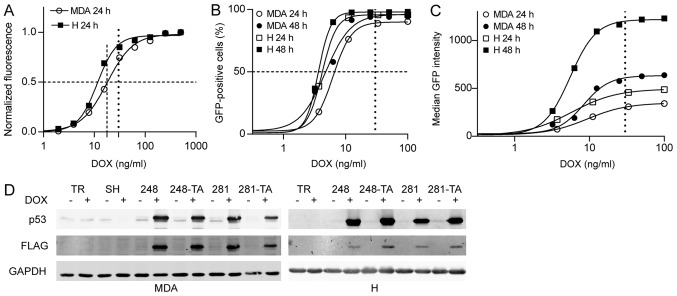
Figure 2.
DOX-induced EGFP and p53 expression in MDA-MB-231 and H1299 cells. (A) The EGFP expression in MDA-TR and H-TR cells induced with 30 ng/ml DOX for 24 h was measured by multiwell spectrofluorimetry. Total fluorescence from 96-well plate wells was measured, obtained data were fitted to a sigmoidal four-parameter curve and the calculated half maximal effective concentrations for DOX were 17.8 ng/ml for MDA and 11.4 ng/ml for H cells. (B and C) The EGFP expression in MDA-TR and H-TR cells induced with 30 ng/ml DOX for 24 and 48 h was also measured by flow cytometry and (B) the percentage of cells that were EGFP-positive and (C) the median EGFP intensity were plotted. The vertical dotted line indicates the 30 ng/ml DOX concentration used in subsequent experiments. The dashed lines indicate 50% of the normalized phenotype intensity. (D) Western blot analysis of the p53 expression in indicated MDA and H cells treated with 30 ng/ml DOX for 48 and 24 h, respectively. The protein expression visualized using anti-p53 and anti-FLAG antibodies in parallel, which were detected in separate fluorescence channels. Faint bands in the MDA-TR lanes and other non-DOX-induced lanes represent endogenous p53 R280K variants. DOX, doxycycline; EGFP, enhanced green fluorescent protein; p53, tumor suppressor p53; MDA, MDA-MB-231; H, H1299; TR, cells with Tet repressor only; SH, cells with silenced endogenous p53; TA, transactivatory domain disruption (L22S/W23Q) in addition to indicated mutation (R248Q or D281G).

