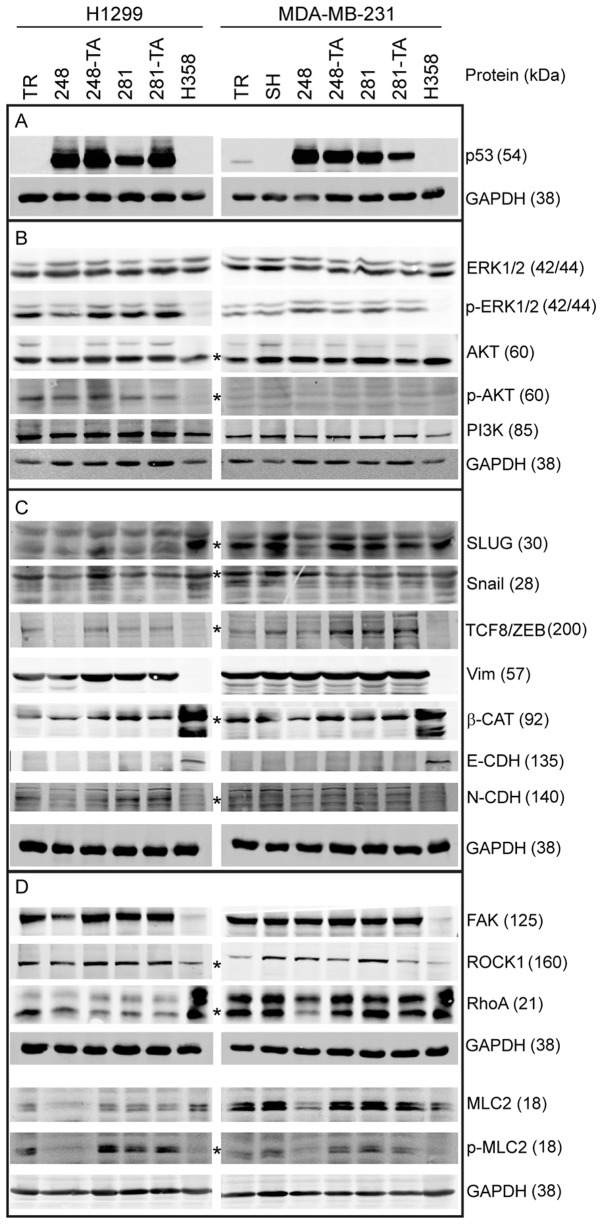
Figure 7.
Western blot analysis of protein expression in MDA-MB-231 cells expressing mutant p53. Cells were induced with 30 ng/ml doxycycline for 48 h, lysed and analyzed by western blotting with 20-40 µg total protein per lane, using fluorescent secondary antibodies and an Odyssey scanner for the detection of bands. (A) Protein expression of induced transgenes in H1299 and MDA-MB-231 cells, and the silencing of endogenous p53 in MDA-MB-231-SH cells. (B) Expression and phosphorylation levels of selected proteins associated with mitogenic signaling. (C) Expression levels of proteins associated with the epithelial-mesenchymal status. (D) Expression levels of proteins associated with the regulation of adhesion and actin-based migration. Wherever the identity of the band representing the marked protein was in doubt, it is marked with an asterisk (*). Apparent molecular weights, as assessed from the western blot markers, are indicated in the parentheses next to the protein identifiers. p53, tumor suppressor p53; p-, phosphorylated; ERK, mitogen-activated protein kinase; AKT, protein kinase B; PI3K, phosphoinositide 3-kinase; SLUG, zinc finger protein SNAI2; Snail, zinc finger protein SNAI1; TCF8/ZEB, zinc finger E-box-binding homeobox 1; Vim, Vimentin; β-CAT, β-catenin; CDH, cadherin; FAK, focal adhesion kinase 1; ROCK1, Rho-associated protein kinase 1; RhoA, Ras homolog family member A; MLC2, myosin light chain 2; TR, cells with Tet repressor only; SH, cells with silenced endogenous p53; TA, transactivatory domain disruption (L22S/W23Q) in addition to indicated mutation (R248Q or D281G).

