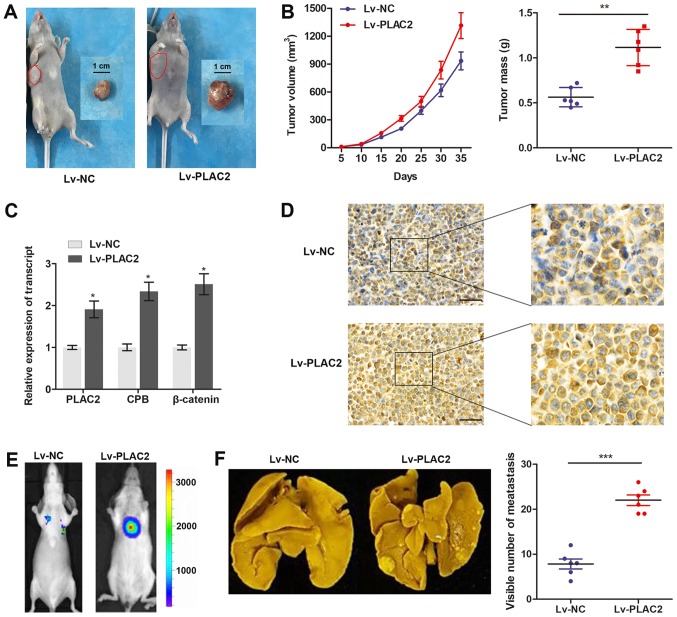
Figure 5.
PLAC2 promotes tumor growth and metastasis in vivo. (A) Representative images of the nude mice and corresponding xenograft fed for five weeks in the Lv-NC or Lv-PLAC2 cell groups. (B) Tumor volume and tumor weight in the Lv-NC and Lv-PLAC2 groups. The tumor volumes were measured every 5 days (tumor volume = length x width2/2). **P<0.01. (C) The transcript expression of PLAC2, CBP and β-catenin in implanted OSCC tissues were measured by reverse transcription-quantitative polymerase chain reaction. *P<0.05, compared with the Lv-NC group. (D) Representative images of β-catenin expression in the implanted OSCC tumors in each group as analyzed by immunohistochemistry. Scale bars: 50 µm; magnification (left, ×10; right, ×40). (E) Lung metastases were quantified using bioluminescence imaging after 5 weeks of initial implantation. Representative in vivo bioluminescent images are depicted. (F) Representative images of metastatic tumor nodules and corresponding quantitative number of metastasis. ***P<0.001. PLAC2, placenta-specific protein 2; NC, negative control; OSCC, oral squamous cell carcinoma; CBP, cAMP-response element binding protein-binding protein.

