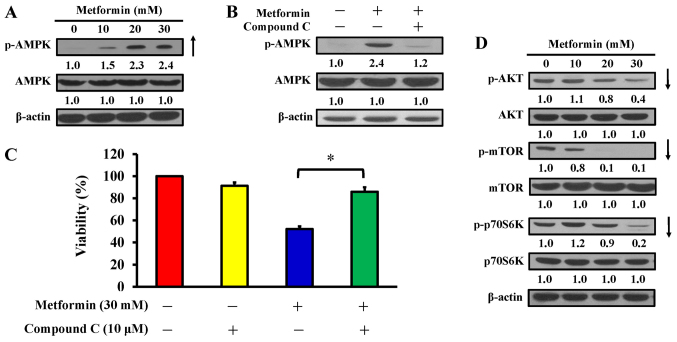
Figure 5.
Effect(s) of metformin on AMPK signaling and its downstream molecules of AGS cells. (A) Cells were exposed to 0, 10, 20 and 30 mM metformin for 12 h and protein levels of p-AMPK and AMPK were detected. (B) Cells were cultured without or with 10, 20 and 30 mM metformin for 12 h following pre-incubation with or without 10 µM compound C (an AMPK inhibitor) for 2 h and protein levels of p-AMPK and AMPK were detected. (C) Cells were treated without or with 30 mM metformin for 48 h after pre-incubation with or without 10 µM compound C for 2 h. Cell viability was estimated by the MTT assay. The values are presented as the mean ± standard deviation of triplicates. *P<0.05 vs. metformin-treated only. (D) Cells were treated without or with 10, 20 and 30 mM of metformin for 12 h and protein levels of p-AKT, AKT, p-mTOR, mTOR, p-p70S6K and p70S6K were determined by immunoblot analysis. β-actin was an internal loading control. p-, phospho; AMPK, adenosine monophosphate-activated protein kinase; AKT, protein kinase B; mTOR, mammalian target of rapamycin; p70S6K, ribosomal protein S6 kinase B1.

