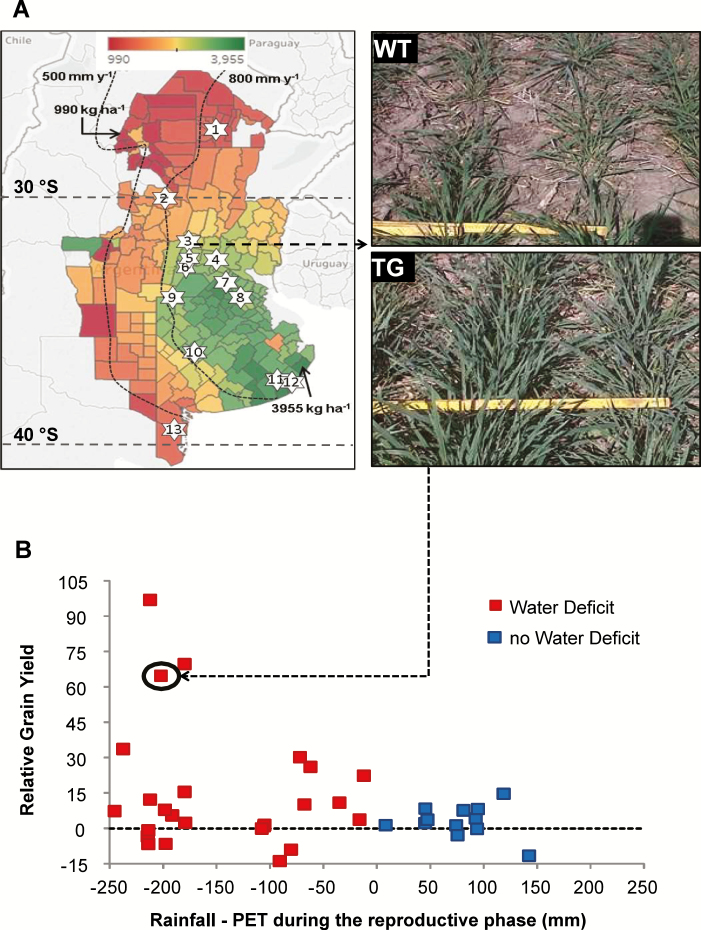
Fig. 3.
Experimental network and relative grain yield of parental cv. Cadenza and transgenic line IND-OO412-7 across the network. (A) Mean 20-year grain yield (1996/1997–2016/2017) across the wheat production region of Argentina and location of INDEAR evaluation sites. Data are expressed at the department level from a minimum of 990 kg ha−1 (dark red) to a maximum of 3955 kg ha−1 (dark green), and their distribution matches the estimated drought probability risk for the evaluated region (www.ora.gob.ar). Isohyets of 500 and 800 mm year−1 were sketched for reference. Areas in white within the region correspond to departments with less than 10 years of wheat production records (www.agroindustria.gob.ar), and areas in green to the west of the 500 isohyet correspond to irrigated production. The numbered stars inside the map indicate the locations of Indear evaluation sites. 1, Charata; 2, Gutemberg; 3, Landeta; 4, Roldán; 5, Monte Buey; 6, Corral de Bustos; 7, Pergamino; 8, Carmen de Areco; 9, Villa Saboya; 10, Daireaux; 11, Balcarce; 12, Camet; 13, Villalonga. (B) Relative grain yield (RGY=(GYIND-ØØ412-7−GYCadenza)/GYCadenza) variation in response to a general water balance computed as the difference between rainfall and potential evapotranspiration (PET) during the reproductive phase (period between anthesis−30 d and maturity). Data correspond to 37 experiments (Group 2 in Supplementary Table S3). Images illustrate WT Cadenza and transgenic (TG) IND-ØØ412-7 plants at tillering corresponding to the encircled value, representative of site 3 on the map (Landeta in 2013).

