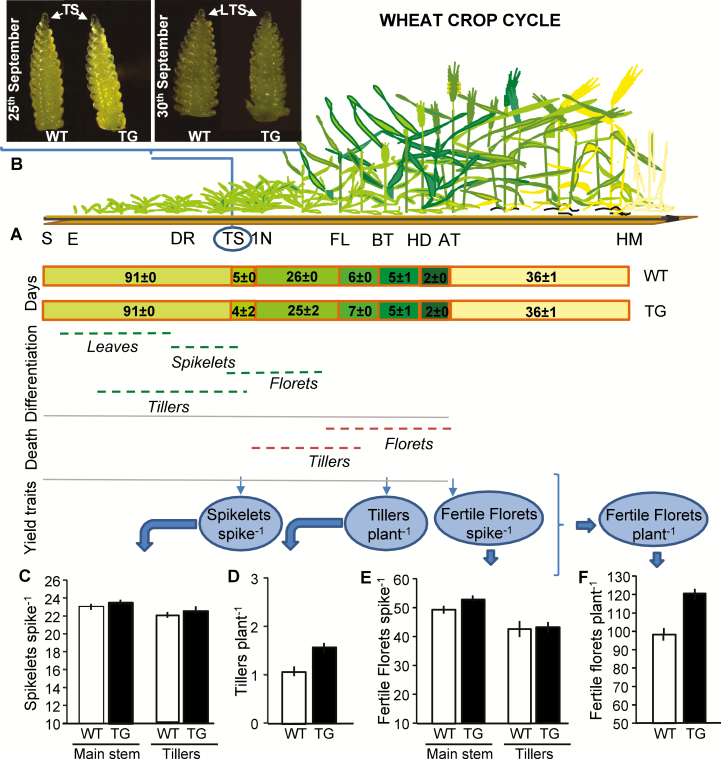
Fig. 5.
Wheat crop cycle and yield generation. Wheat plants cycle illustration was adapted from Slafer and Rawson (1994). 1N, first node detectable; AT, anthesis; DR, double ridge; E, emergence; FL, flag leaf; HD, heading; HM, harvest maturity; S, sowing; TS, terminal spikelet. (A) Days between external phenological events. (B–F) Apex development at the terminal spikelet (TS) and late terminal spikelet (LTS) stages (B), and determinants of fertile florets plant−1 registered on nine plants per genotype (three plants from each replicate) (C–F) for WT Cadenza and transgenic (TG) IND-ØØ412-7 at Pergamino during 2017. Error bars represent 2×SEM.

