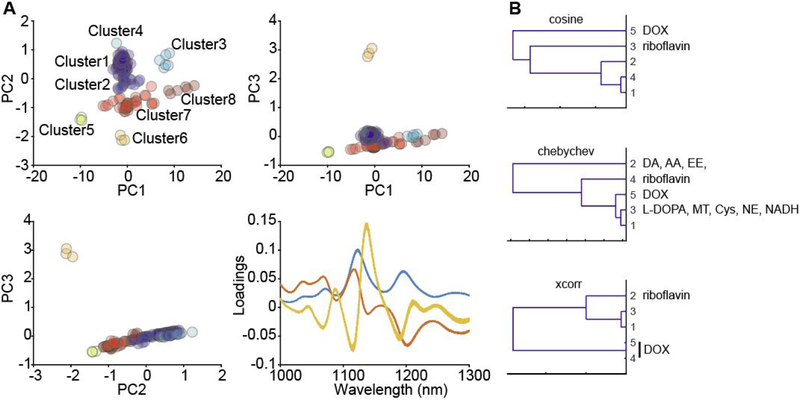
Figure 4.
(A) Principal component analysis for an analyte library screened against the DNA-wrapped SWNT nanosensor CB13. Each dataset can be plotted using different principal component coordinates. Samples are clustered using hierarchical clustering computed with centroid distances calculated using a Euclidean metric and normalized principal components. Cluster assignments for each sample are listed in the Supporting Information. A plot of the loadings represents the spectral characteristic of each principal component. (B) Hierarchical clustering dendrograms generated using three different distance metrics for library data acquired for the DNA-wrapped SWNT nanosensor CB13. DA: dopamine, AA: ascorbic acid, EE: epinephrine, DOX: DOX, NE: norepinephrine, Cy: L-cysteine.

