
Figure 2. Clonotype and sequence diversity amongst the 10 subjects.
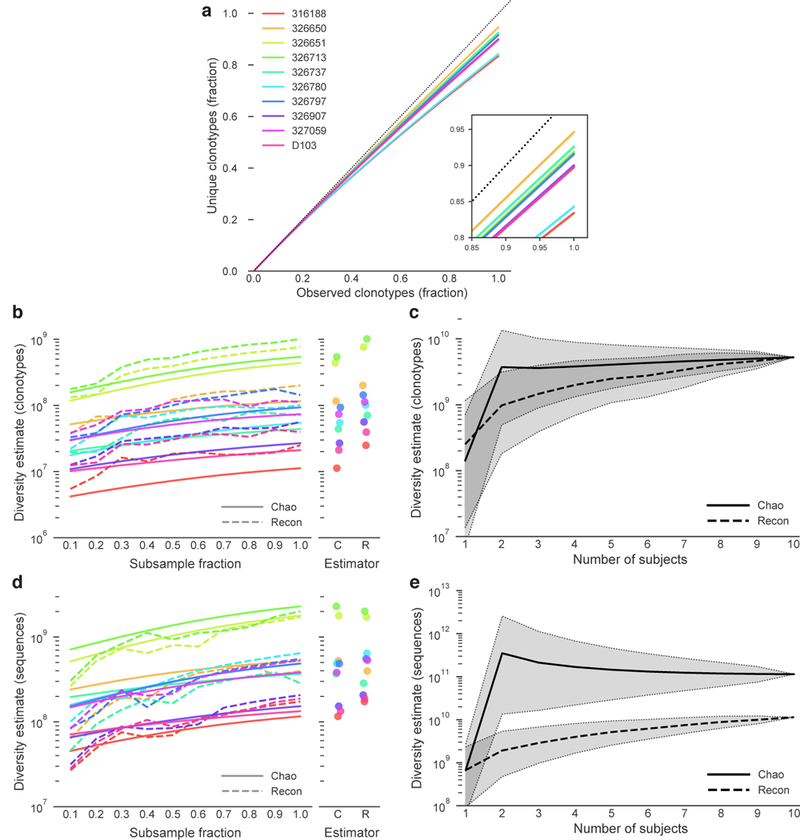
a) Clonotype rarefaction curves for each subject. Lines represent the mean of 10 independent samplings, with the exception of the 1.0 fraction, which was sampled once. The dashed line represents a perfectly diverse sample. Inset is a close-up of the rarefaction curve ends. b) Total clonotype repertoire diversity estimates were computed for increasingly large fractions of each subject’s clonotype repertoire. Each line represents the mean of 10 random sub-samplings without replacement (again, except for the 1.0 fraction). Chao estimates are shown in solid lines, Recon estimates are shown in dashed lines. Subject colors are as in (a). Maximum diversity (1.0 fraction of each subject) for each estimator is shown in the right panel. c) Overall cross-subject clonotype diversity of each possible combination of 1 or more subjects. The Chao estimate is a solid line and the Recon estimate is a dashed line. Shaded regions indicate 95% confidence intervals. The confidence intervals in (c) are for different groupings of subjects, not for the estimators themselves. d) Total sequence repertoire diversity estimates were computed for increasingly large fractions of each subject’s sequence repertoire. Each line represents the mean of 10 random sub-samplings without replacement (except for the 1.0 fraction, for which only a single calculation was made). Chao estimates are shown in solid lines, Recon estimates are shown in dashed lines. Subject colors are as in (a). Maximum diversity (1.0 fraction of each subject repertoire) for each estimator is shown in the right panel. e) Overall cross-subject nucleotide sequence diversity of each possible combination of 1 or more subjects. The Chao estimate is a solid line and the Recon estimate is a dashed line. Shaded regions indicate 95% confidence intervals. Confidence intervals are as in (c).