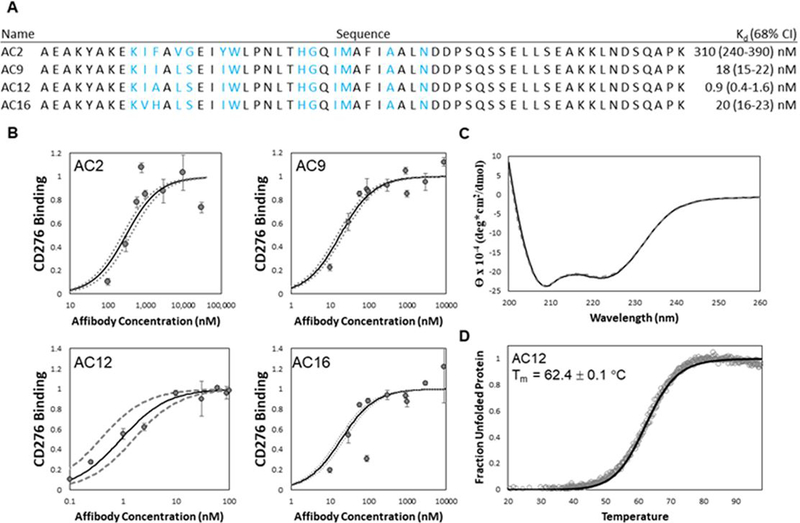
Figure 9. Characterization of parental and evolved CD276-binding Affibodies.
(A) affibody variants AC2, AC9, AC12, and AC16 were characterized for their binding affinity (KD). Blue lettering indicates diversified residues in the helix-walking libraries. (B) Purified affibody variants AC2 (upper-left), AC9 (upper-right), AC12 (lower-left), and AC16 (lower-right) were used to label MS1-CD276 cells at the indicated concentrations. Binding was quantified by flow cytometry. The best-fit estimate of KD and 68% confidence interval are indicated by solid and dashed lines, respectively. (C) Purified affibody AC12 was analyzed by circular dichroism spectroscopy in triplicate between 200 and 260 nm wavelengths before (solid) and after (dashed) thermal denaturation and cooling. (D) Purified affibody AC12 was scanned at a wavelength of 220 nm during heating from 20 to 98 °C (1 °C/min). The midpoint of thermal denaturation (Tm) was calculated by linear least-squares regression using a two-state protein unfolding model.

