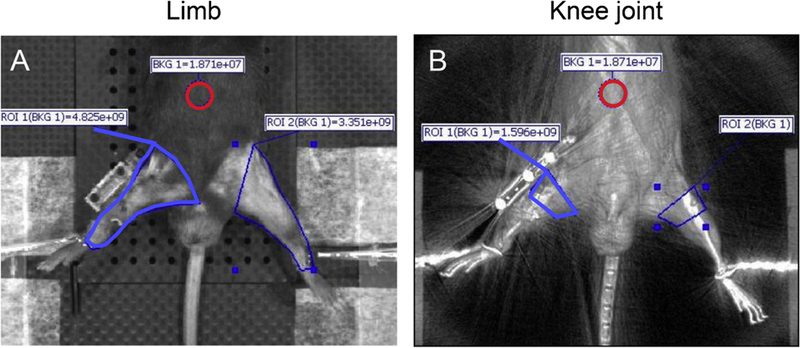
Figure 4.

Quantitative analysis of IVIS images. Methodology of setting the region of interest (ROI) for quantifying fluorescent signals in each knee. (A) The ROI was set on the entire limb from heel to inguinal line (indicated by blue line). The background was set at the center of the abdomen (indicated by red circle). (B) The ROI was focused on the knee joint, registered to superimposed X-ray image (indicated by blue line). The background was set to the center of the abdomen (indicated by red circle).
