Figure 7.

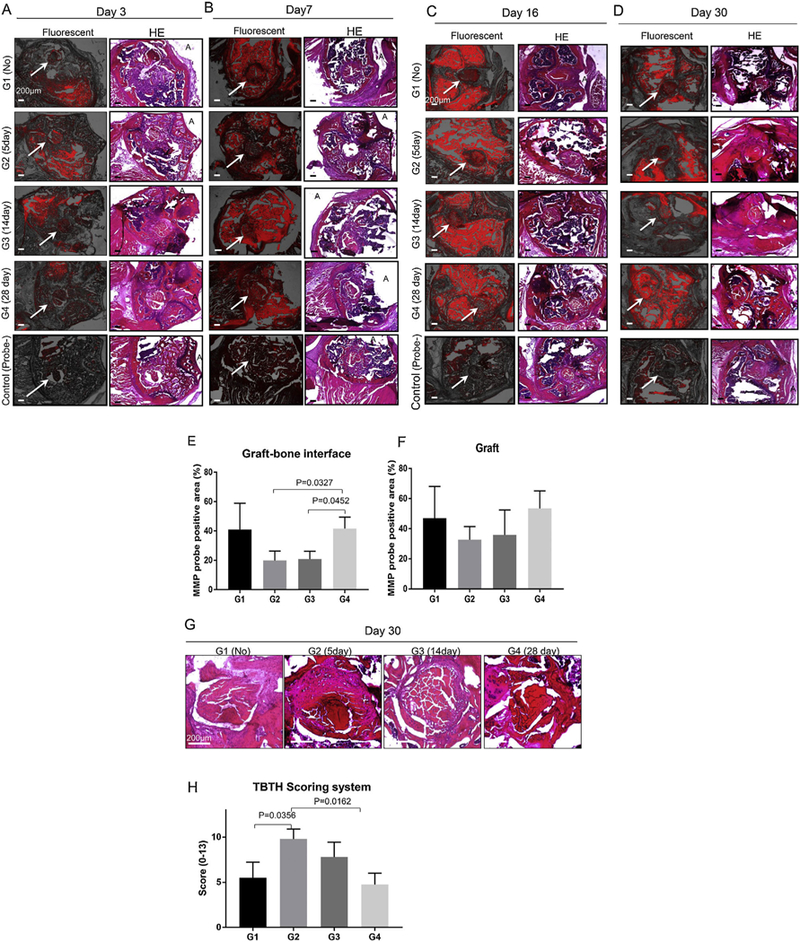
Representative transverse section of fluorescent microscope and hematoxylin eosin (HE) pictures of each group at each time point. (A) Day 3. (B) Day 7. (C) Day 16. (D) Day 30. Left column is fluorescent image (MMP 680 probe fluorescence is red). Right column is HE stained section. A indicates anterior aspect of femoral condyle. Scale bar = 200 μm. White arrows indicate bone tunnel and graft. The control group was not injected with probe. Control specimens showed much less signal than study specimens. Probe signal intensity seemed to peak at day 16 (Fig. 6C) time points in all groups. MMP probe fluorescent positive area at graft-bone interface (E) and graft at day 30 (F). All data are presented as mean ± standard deviation (n = 5). p-value was calculated by one-way ANOVA with post hoc Tukey’s test. There was a significant difference in MMP probe positive area at the graft-bone interface between Groups 2, 3, and 4 (p < 0.05). (G) Representative transverse section of magnified graft and bone tunnel pictures of each group at day 30. Scale bar = 200 μm. (H) Tendon Bone Tunnel Healing (TBTH) scoring system. Group 2 showed better score than Group 1 and Group 4 (p < 0.05).
