
Figure 1. AS-MS screen and characterization of RLS-7 as a Siah small molecule inhibitor.
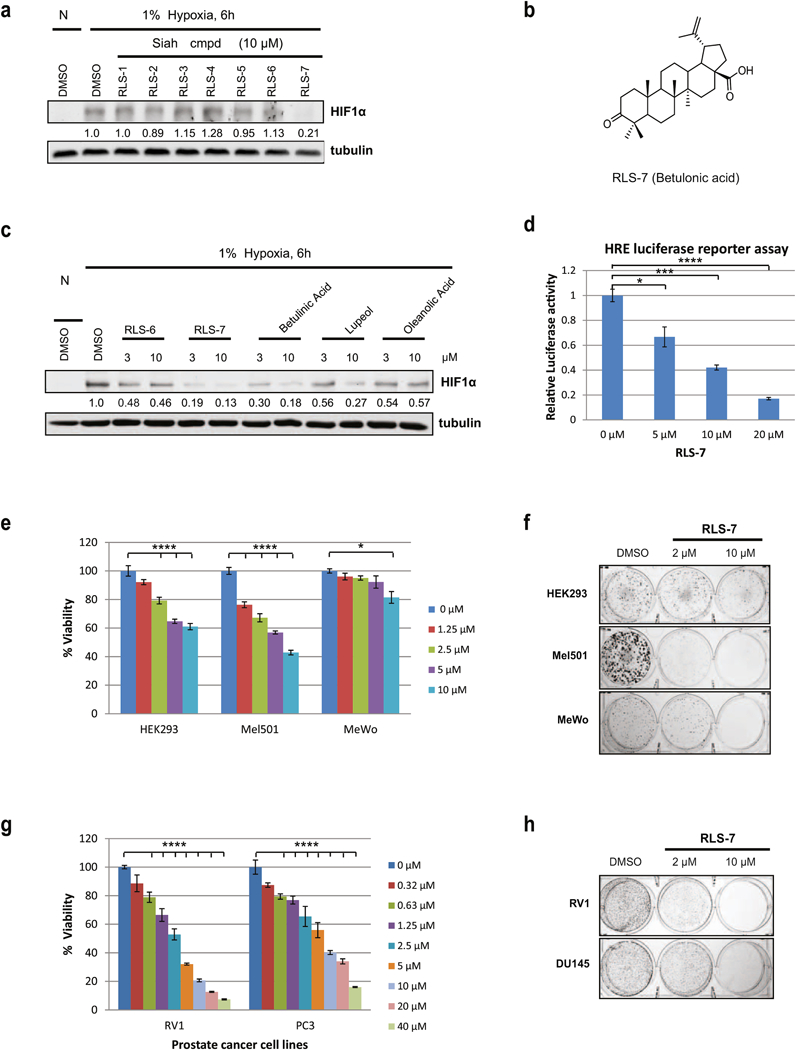
(a) Inhibition of hypoxia-induced HIF1α induction by seven representative compounds from 3 scaffolds. HEK293 cells were incubated with either vehicle (DMSO) or 10 µM of indicated compounds for 6 h under hypoxia. Cells were harvested and whole cell lysates were immunoblotted with the indicated antibodies. (N – normoxia; H - hypoxia). Quantification of the proteins in immunoblots was performed with the aid of BioRad densitometer, relative to loading control, noted under the respective gels. (b) RLS-7 structure. (c) Comparison of RLS-6 with RLS-7 and close analogs. Cells were treated with different compounds at 3 µM and 10 µM and subjected to Wester n Blot, as described above. Quantification of immunoblots was performed using BioRad densitometer, relative to loading controls, noted under the westerns (d) Inhibition of HRE luciferase activity by RLS-7. 293T cells were transfected with HRE-firefly and renilla luciferase plasmids for 24 hours and treated with indicated concentrations of RLS-7 under hypoxia. After 24 hours, cells were lysed and subjected to a luciferase assay. Data were calculated relative to DMSO-treated cells. Means ± standard errors calculated from three independent experiments. *p < 0.05, **p < 0.01, ***p < 0.001, ****p < 0.0001 compared to controls (one-way ANOVA with Dunnett’s test). (e) Inhibition of HEK293 and melanoma cell viability by RLS-7. HEK293 and different melanoma cells were plated in 96-well plates and incubated with indicated concentrations of RLS-7. Cell viability was assessed by ATPlite after 72 h. Growth inhibition was calculated as percentage of DMSO-treated controls. Each bar represents the mean ± standard deviation of three experiments. Shown is a representative experiment. ****p < 0.0001 as compared to the control (one-way ANOVA with Dunnett’s test). (f) Colony formation assay. Indicated cultures were plated at low density (500 cells/well in 6-well plates) and grown in medium containing vehicle, or 2 µM or 10 µM RLS-7. The number of colonies formed after 10 days in culture was determined by crystal violet staining. (g) Prostate cancer cell lines RV1 and PC3 were treated with indicated concentrations of RLS-7. Cell viability was assessed 72 h later. ****p < 0.0001 as compared with the control, as described above (one-way ANOVA with Dunnett’s test). (h) RV1 and Du145 cells were plated at low density and grown in medium containing indicated concentrations of RLS-7. The number of colonies formed after 2 weeks was determined by crystal violet staining.