
Figure 4. In Silico screen and characterization of Siah small molecule inhibitors.
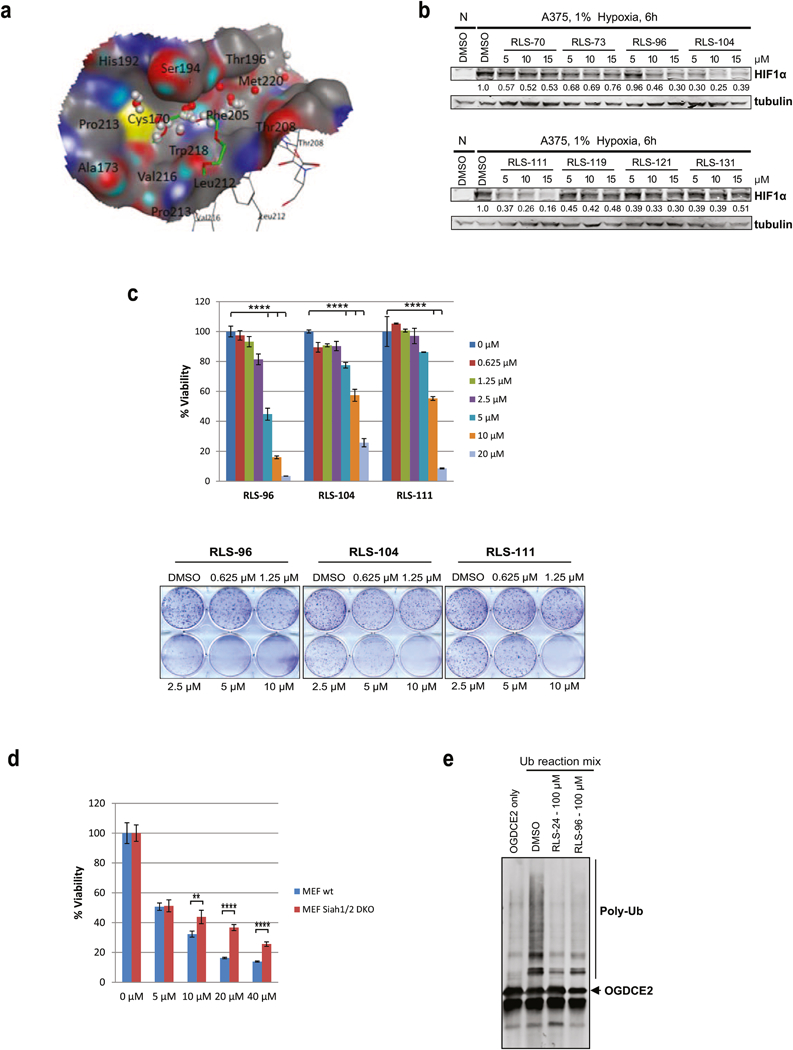
(a) The SiteFinder module of MOE software predicted a small molecule binding pocket using Siah2 crystal structure 5H9M at where the co-crystalized pentaethylene glycol PEG400 in green is. The grey spheres are the hydrophobic probes and the red spheres are the electrostatic probes. (b) Melanoma cells were incubated with 5 µM, 10 µM and 15 µM of selected compounds for 6 h under hypoxia. Cells were harvested and whole cell lysates were immunoblotted with indicated antibodies. Quantification of immunoblots was performed using BioRad densitometer, relative to loading controls, noted under the blots (c) Viability and colony formation assays of RLS-96, RLS-104, and RLS-111 in A375 cells. Each bar represents the mean ± standard deviation of three measurements. Representative data is shown. ****p < 0.0001 was calculated based on comparison with the control (one-way ANOVA with Dunnett’s test). (d) MEFs and Siah1/2 double knock out MEFs were treated with indicated concentrations of RLS-96, and cell viability was assessed by ATPlite after 72 h. Each bar represents the mean ± standard deviation of three measurements. **p < 0.01, ***p < 0.001, were calculated using Student’s t test (e) Compounds RLS-24 and RLS-96 were incubated with the Siah2 substrate OGDCE2 and subjected to an in-vitro ubiquitination assay, as described in Figure 3g.