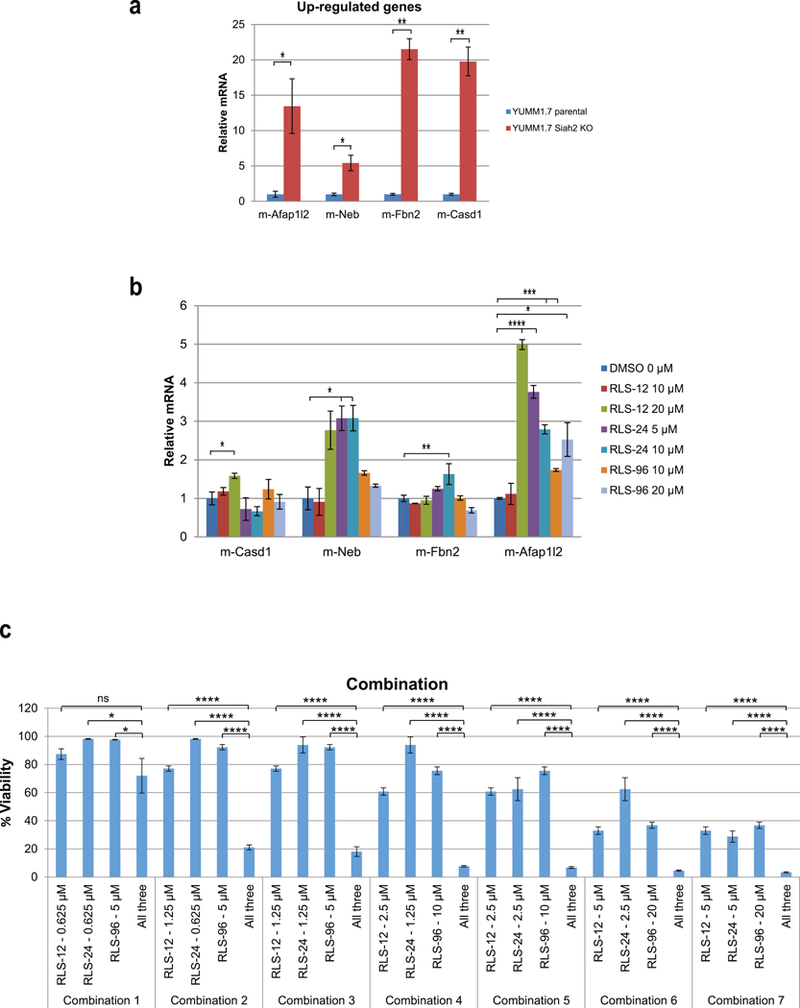
Figure 6. Siah1/2 inhibitors phenocopy gene expression pattern seen in genetically inactivated Siah2 and their combination elicits additive effect.

(a) Level of transcripts for selected genes upregulated in YUMM1.7, in which Siah2 was subjected to CRISPR-CAS9 KO compared with control YUMM1.7 Siah2 WT cells. Each bar represents the means ± standard error from two experiments. *p < 0.05, **p < 0.01, were calculated using Student’s t test. (b) RNAs were extracted from YUMM1.7 cells following treatment with indicated concentration of RLS-12, RLS-24 and RLS-96 for 24 h, followed by qPCR analysis. Each bar represents the means ± standard error from two experiments. *p < 0.05, **p < 0.01, ***p < 0.001, ****p < 0.0001 were calculated using Student’s t test. (c) A375 cells were treated with single or combination of three compounds at indicated concentrations. Cell viability was assessed 72 h later using ATPlite. Each bar represents the mean ± standard deviation of three measurements. *p < 0.05, ****p < 0.0001 were calculated using Student’s t test.
