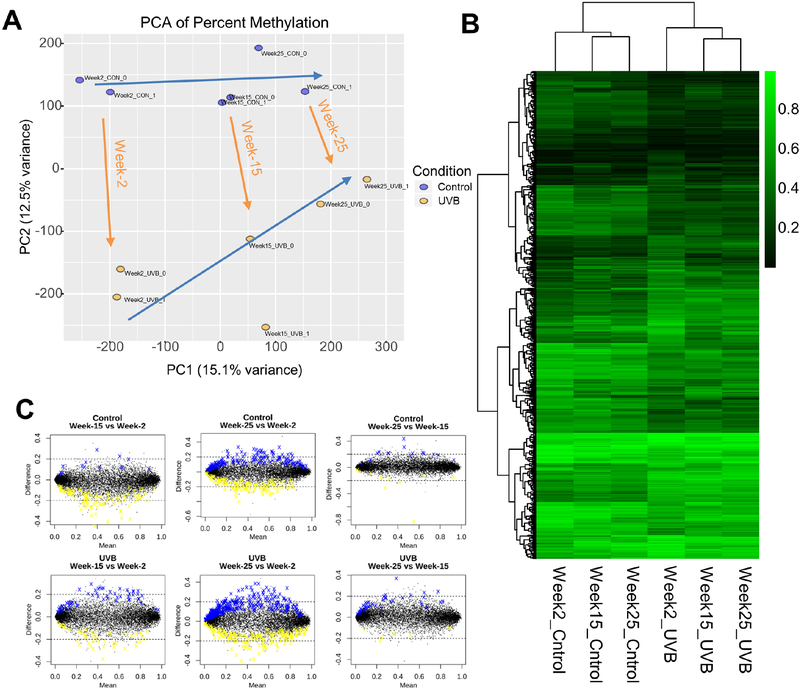
Figure 3. DNA methylation changes at different stages of carcinogenesis.
(A) Principal component analysis (PCA) on the same 12 samples. Two blue arrows showing the shifting trends of age and orange arrows showing the shifting trends of UVB irradiation. Note the two blue arrows approach each other as age progresses. (B) Heatmap showing average methylation ratio of 974 DMRs from Control and UVB conditions for all three time points. These 974 DMRs are the same as identified in Figure 2F. All six groups are from epidermis samples. (C) MA plots showing methylation changes between timepoints for Control condition (upper three plots) and UVB condition (lower three plots).

