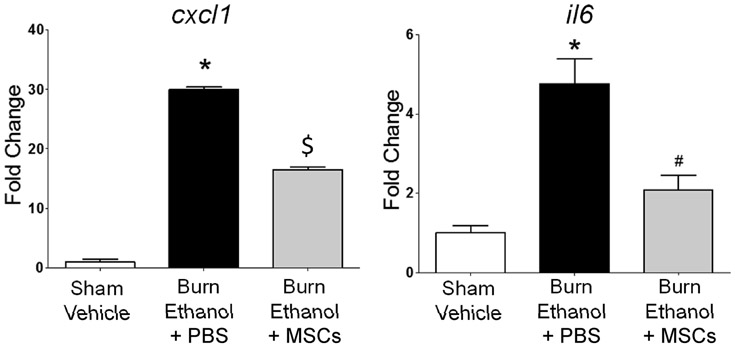
Fig. 4.
Gene expression levels of liver cytokines and chemokines. Quantitative RTPCR was performed to measure expression levels of A) cxcl1 and B) il6 in liver tissue. Results were analyzed using the ΔΔCt algorithm[14] with GAPDH as the endogenous control. Data are representative of two independent experiments and presented as mean fold change ± SEM relative to sham-injured, vehicle treated controls. n = 2-6 per group; *p<0.05 compared to sham vehicle, #p<0.05 compared to burn ethanol + PBS, and $p<0.05 compared to all other groups by One-way ANOVA with Tukey’s multiple comparison test.

