
Figure 3: MSCs and OPCs exhibit increased ER stress.
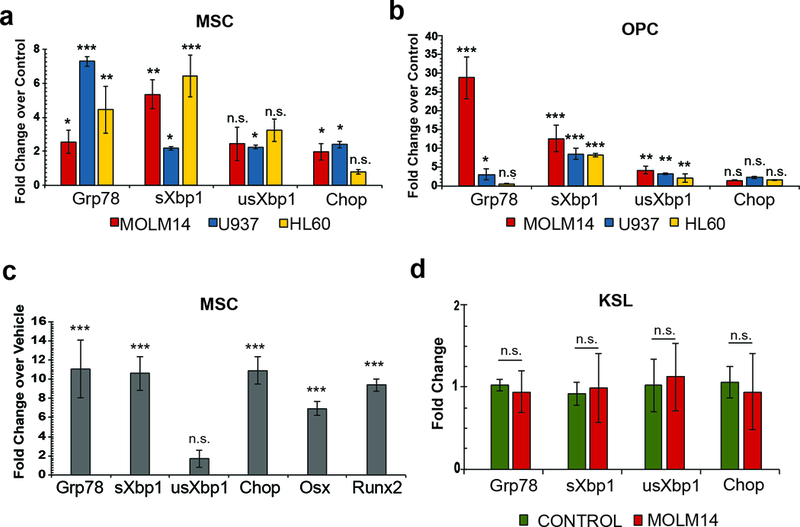
(a-b). Expression analysis of genes involved in the UPR from xenograft-derived MSCs (a) and OPCs (b). Fold change determined by 2-ΔΔCt in pairwise analysis against control MSC and OPCs, respectively. Error bars are standard error of the mean from four animals per condition. Significance was determined by ANOVA and Student’s t-test. *P<0.05, **P<0.01, ***P<0.001. (c) Expression analysis of genes involved in the UPR and osteogenesis in MSCs cultured in 1ng/mL thapsigargin compared to vehicle-treated MSCs. Fold change determined by 2-ΔΔCt against control cells. Error bars are standard error of the mean from three biological replicates. Significance was determined by Student’s t-test. ***P<0.001. (d) Expression analysis of UPR genes in hematopoietic stem cells (c-KIT+, SCA-1+, lin−; KSL) from Molm-14 xenografts. Fold change determined by 2-ΔΔCt against KSL from control animals. Error bars are standard error of the mean from three animals per condition. Significance was determined by Student’s t-test. *P<0.05, **P<0.01, ***P<0.001.