
Figure 4: AML EVs traffic to the ER of MSCs and OPCs.
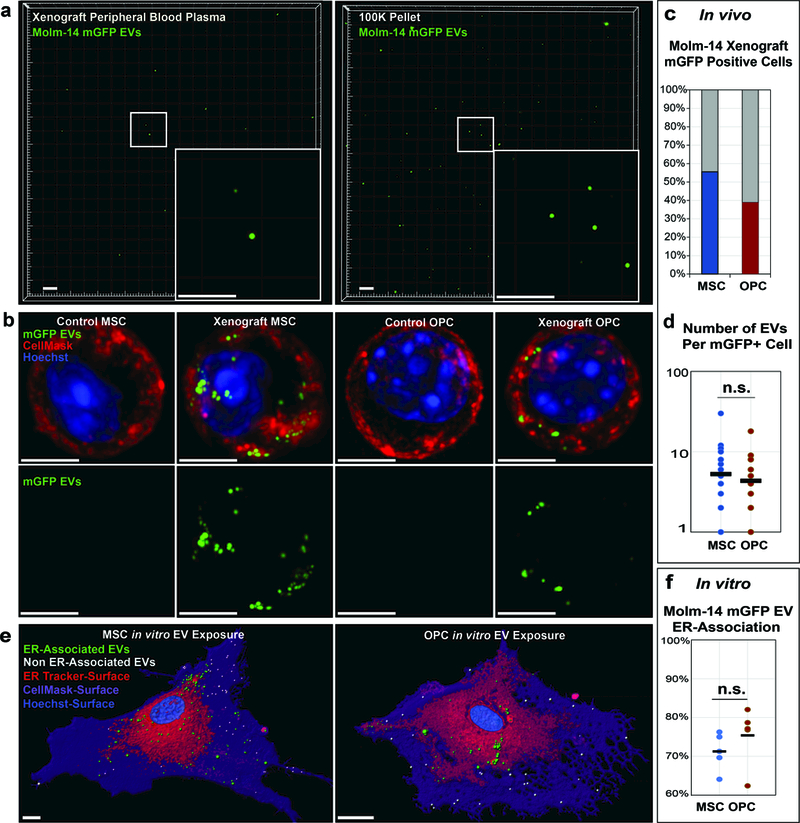
(a) Solid capture imaging of mGFP+ EVs from peripheral blood of Molm-14-mGFP xenografts (left) and from in vitro Molm-14-mGFP cells (right). Scale bars are 5μm. (b) Live-cell imaging of MSCs and OPCs derived from control and Molm-14-mGFPxenografts. mGFP: green, Cellmask: red, Hoechst: blue. Scale bars are 5μm. (c) Quantification of Molm-14-mGFP xenograft-derived MSCs and OPCs containing mGFP+ vesicles. 50 cells per cell type analyzed from 2 animals. (d) Quantification of mGFP+ vesicles per positive MSC and OPC derived from Molm-14-mGFP xenografts. 50 cells per cell type analyzed from 2 animals, significance determined by Student’s t-test *P<0.05. (e) Representative images of live-cell, confocal microscopy of in vitro expanded MSCs (left) and OPCs (right) exposed to EVs harvested from Molm-14-mGFP cells. Green: ER-localized mGFP+ vesicles, white: cytosol-localized mGFP+ vesicles, red: ER surface, purple: plasma membrane surface, blue: Hoechst. Scale bars are 5μm. (f) Quantification of ER-localization of internalized mGFP+ vesicles in in vitro expanded MSCs and OPCs. 5 cells per cell type analyzed, significance determined by student’s T-test *P<0.05