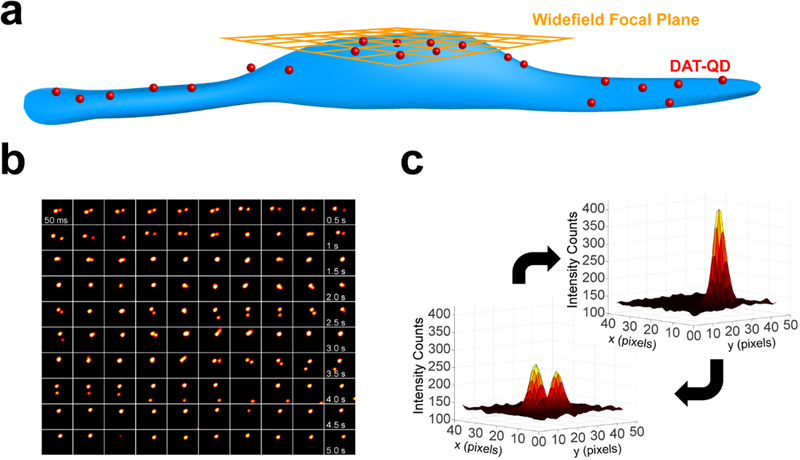
Figure 6. Intensity-based widefield imaging analysis reveals clusters at the apical cell surface.
(a) Cartoon outlining the experimental widefield focal plane (orange) and DAT-QD (red) localization. (b) Representative montage of widefield epifluorescence micrographs of two DAT-QD PSFs interacting over a period of 5 s. (c) 3D surface plots of representative PSFs for single DAT-QDs and DAT-QD clusters.

