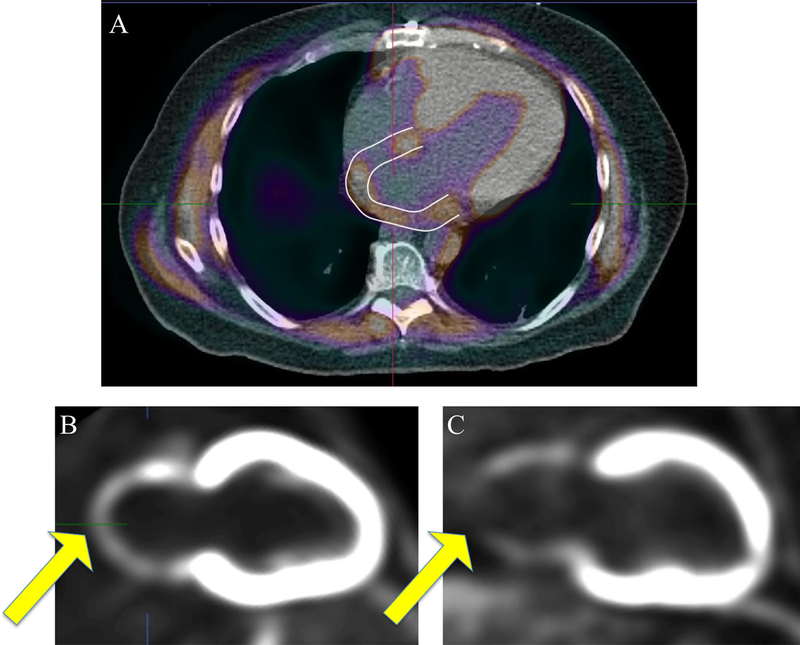
Figure 1.
FDG PET/CT and left atrial area of interest. Integrated FDG and CT imaging with contoured region of interests excluding ventricular and extra-cardiac structure are shown in panel A. Vertical long-axis reconstructions showing nonnormalized left atrial FDG-uptake patterns are displayed in panels B and C. Panel B demonstrates relatively homogenous uptake of FDG throughout the atria compared to panel C, which demonstrates a defect consistent with hypometabolic scar. CT computed tomography. FDG, 18F-fluorodeoxyglucose.

