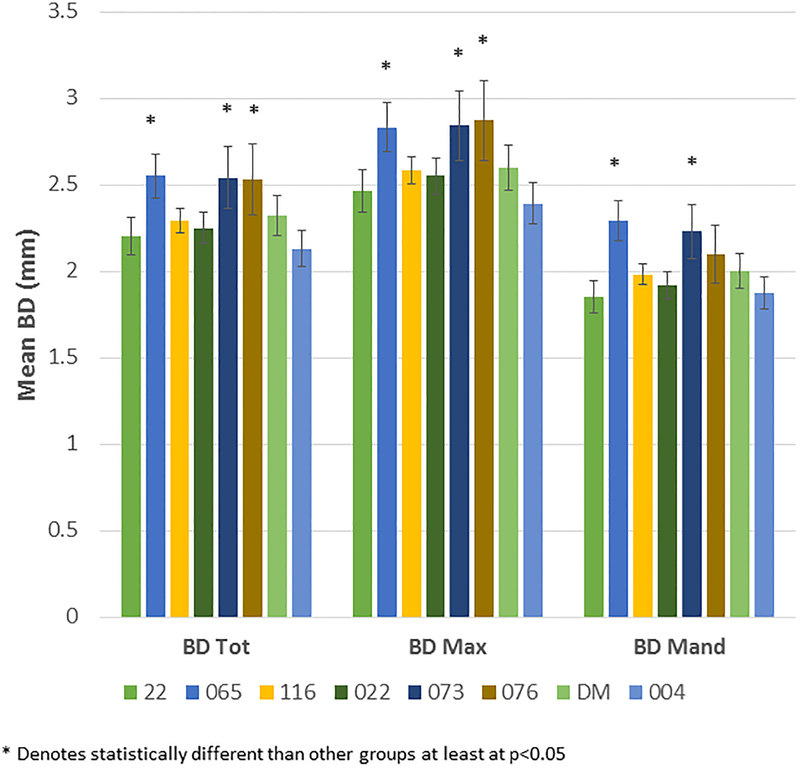
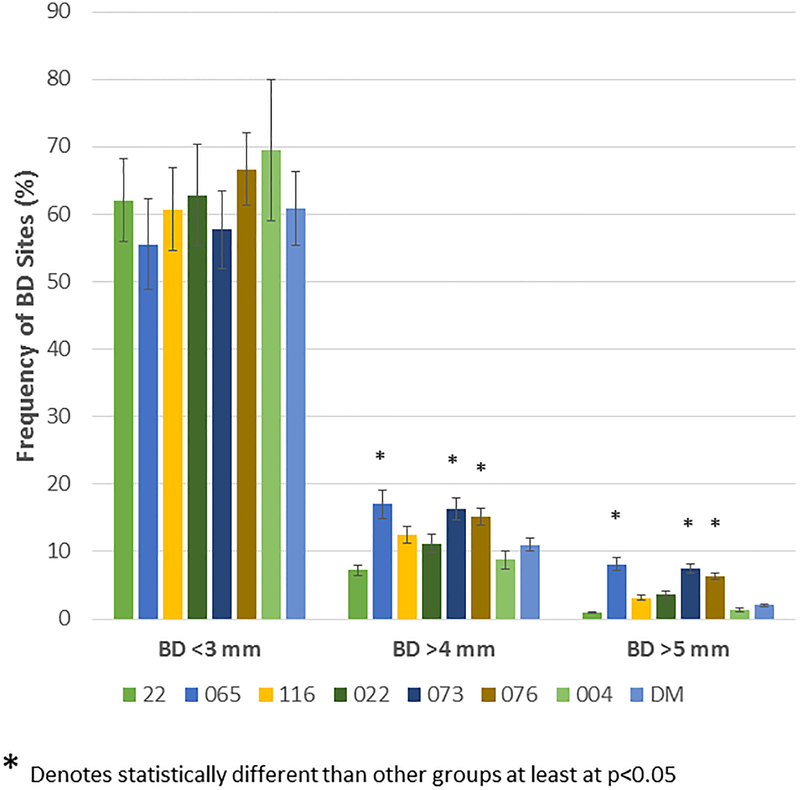
Figure 3:
(A) Bars denote the mean bone defect for the matrilines for total mouth (BD Tol), maxillary (BD Max) and mandibular (BD Mand) quadrants. Vertical brackets enclose 1 SD. (B) Bars denote the mean % of sites with bone measures of < 3, >4, and >5 mm in each skull stratified by matriline. Asterisk (*) denotes significantly different than other groups at least a p<0.05. (C) Bars signify the frequency of skulls (animals) in each matriline that demonstrated bone defects of >5 mm. Asterisk (*) denotes significantly different than other groups at least a p<0.05.


