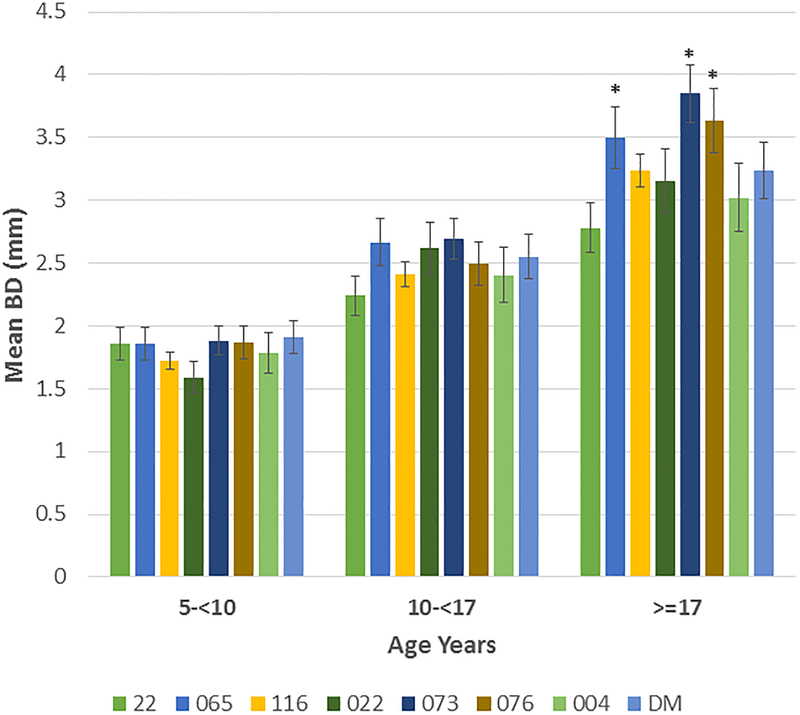
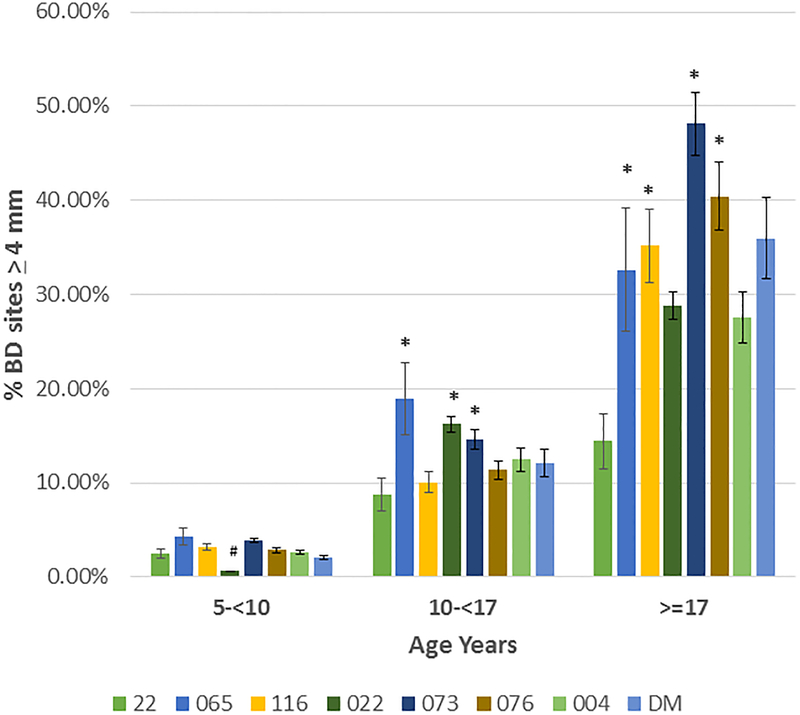
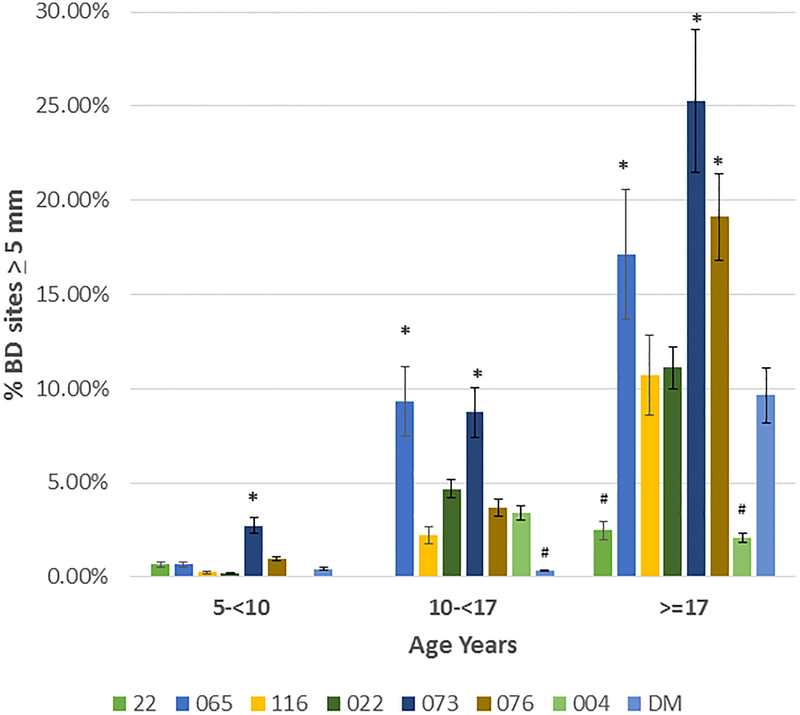
Figure 4:
(A) demonstrates the mean bone defect for the skulls in each matriline stratified according to age of the animal at the time of death. (B) description of frequency of sites in skulls of each matriline stratified on age. (C) description of frequency of sites in skulls of each matriline stratified on age. Bars denote group mean and vertical brackets enclose 1 SD. Asterisk (*) denotes significantly different than other groups at least a p<0.05. Hashtag (#) denotes the groups with significantly less disease compared to all other matrilines at least at p<0.05.


