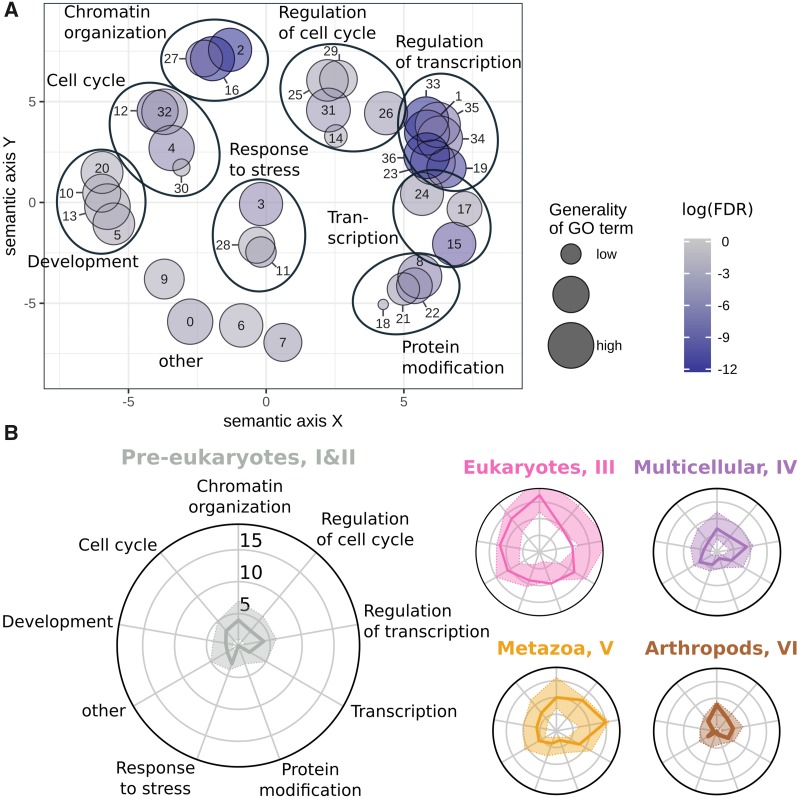
Fig. 2.
—Diversity in functional annotations at evolutionary age groups. (A) Enriched GO terms of CAPs projected on a 2D semantic space. The GO terms are clustered into eight higher level GO groups as indicated by the large ovals (see Materials and Methods for details). The “other” group is left without oval. See supplementary table 4, Supplementary Material online, for details. (B) For each age group, a radar plot shows the distribution of GO terms from annotated proteins. Axes correspond to the number of CAPs in the higher level GO groups of panel (A). For example, in the leftmost radar plot we observe four CAPs in the GO cluster “Chromatin organization.” The colored area around the solid line indicates the 95% boundaries of a randomized background distribution. Pre-eukaryotes aryotes means pre-eukaryotic gene age (cluster I and II), Eukaryotes is eukaryotic age (cluster III), Multicellular is multicellular plant and metazoan age (cluster IV), Metazoa is metazoan age (cluster V), and Arthropods is arthropod age (cluster VI).

