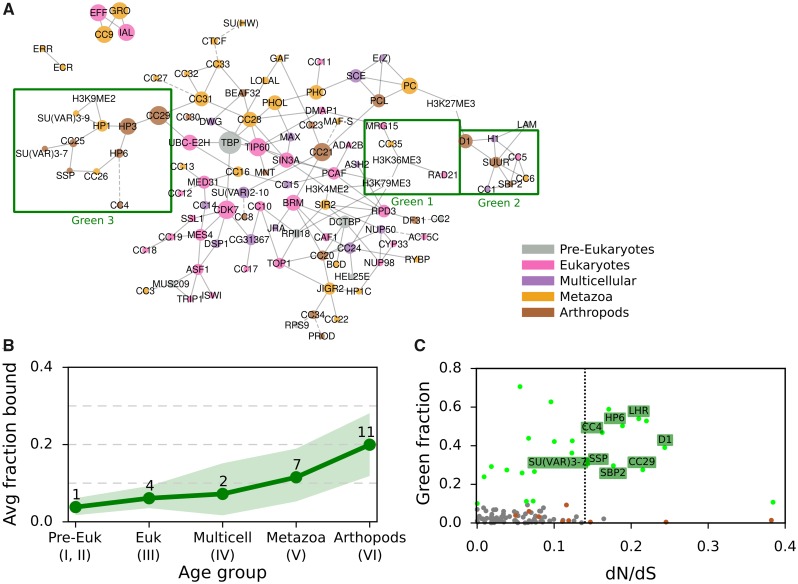
Fig. 5.
—GREEN-associated proteins over evolutionary age and their dN/dS ratio. (A) Bayesian network of CAPs adapted from van Bemmel et al. (2013), with each CAP colored by age. Proteins and histone marks are connected by a solid line if the predicted interaction has a confidence score of at least 70%. Dashed lines indicate the highest scoring interaction for proteins with all confidence scores <70%. Three GREEN chromatin subnetworks are highlighted with a green box. (B) Average fraction of GREEN chromatin bound by CAPs of each evolutionary age group, with 95% confidence intervals obtained through bootstrap analysis. See figure 1 “Fraction bound in chromatin types” for the individual proteins and their fraction of chromatin bound and figure 3 for details on the bootstrap method. (C) The ratio of nonsynonymous over synonymous amino acid mutations (dN/dS) against the GREEN fraction bound for each of the 107 CAPs. The dotted vertical line divides CAPs with dN/dS >0.135 (15% higher of distribution) from the rest. Chromatin proteins are gray dots, with GREEN ones as green dots. GREEN Arthropod Cluster proteins (GAPs) are labeled with their names, while other proteins of the Arthropod Cluster are brown dots.

