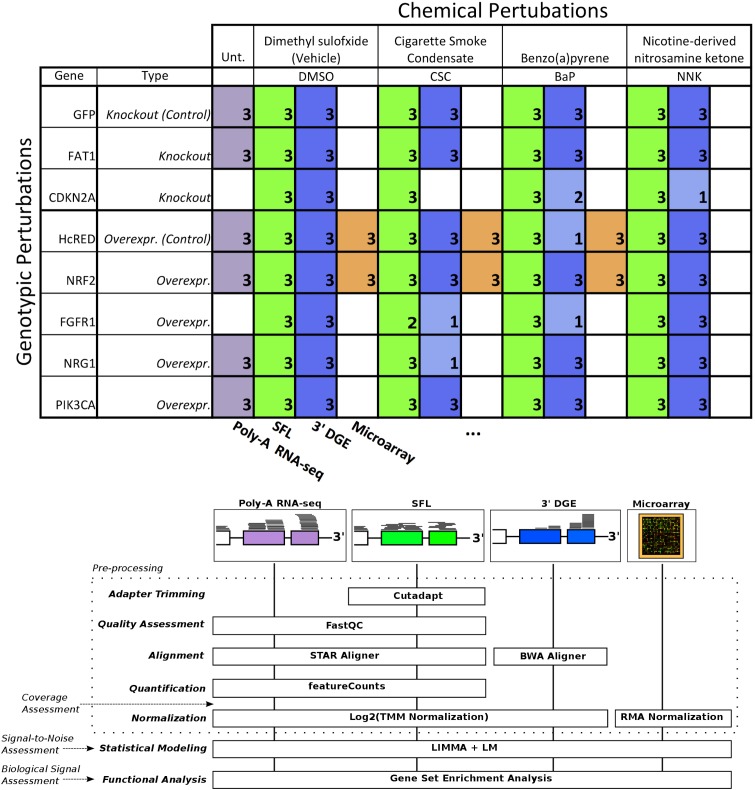
FIGURE 1.
Design of cross-platform experiments and high-throughput data processing. Schematic of the number of each pair of genotypic and chemical perturbations, as well as a summary of preprocessing methods used to quantify gene-level expression for each platform. Note that “Unt.” is an abbreviation of “untreated,” denoting that the RNA-seq samples used in this experiment did not receive chemical perturbations. Numbers in each box represent biological replicates of each condition. The color scheme for each platform is consistent throughout this report.

