FIGURE 2.
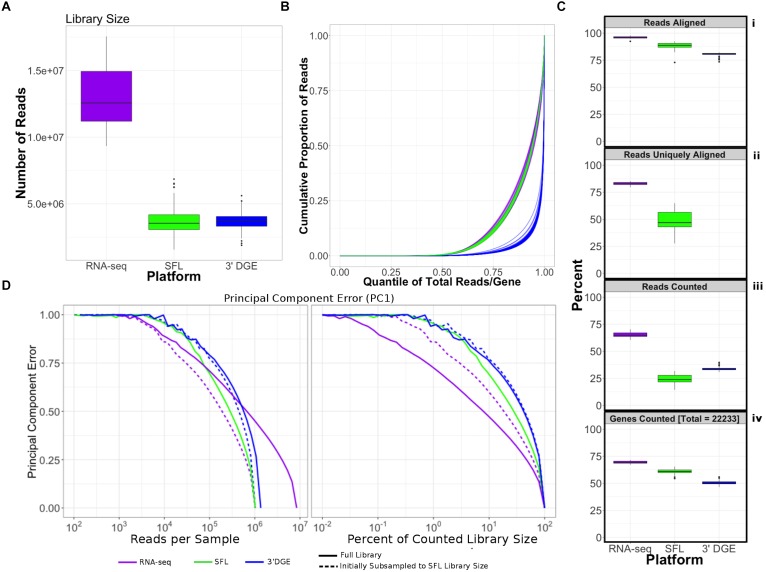
Comparison of coverage between poly-A RNA-seq, SFL, and 3′DGE. (A) Boxplots of distribution of library size for each platform. (B) Cumulative distribution of reads assigned to individual genes per sample. The x-axis indicates the quantile for each gene in terms of ranking by relative expression. The y-axis shows the cumulative proportion of total counted reads assigned to these genes, i.e., the running sum of reads divided by the total number of reads across all genes. (C) The top 3 boxplots show the percentage of reads aligned (i), uniquely aligned (ii), and counted (iii) relative to the total library size for each platform. The bottom boxplot (iv) shows the proportion of genes with counts > 1, for protein-coding genes annotated across all 3 platforms (18,488). For (ii), “Reads Uniquely Aligned” is not shown for 3′DGE because “Reads Uniquely Aligned” and “Reads Counted” are the same values as a result of the data pre-processing protocol, specific to 3′DGE (see section “Materials and Methods”). Counts values for these percentages are given in Supplementary Figure S1A. (D) Analysis of the principal component error of subsampled counted library sizes for full coverage poly-A RNA-seq, SFL, and 3′DGE for principal component 1. Results for principal component 2–5 is shown in Supplementary Figure S1D. Initial subsamples of Poly-A RNA-seq and 3′DGE to the SFL library size are also given as dotted lines.

