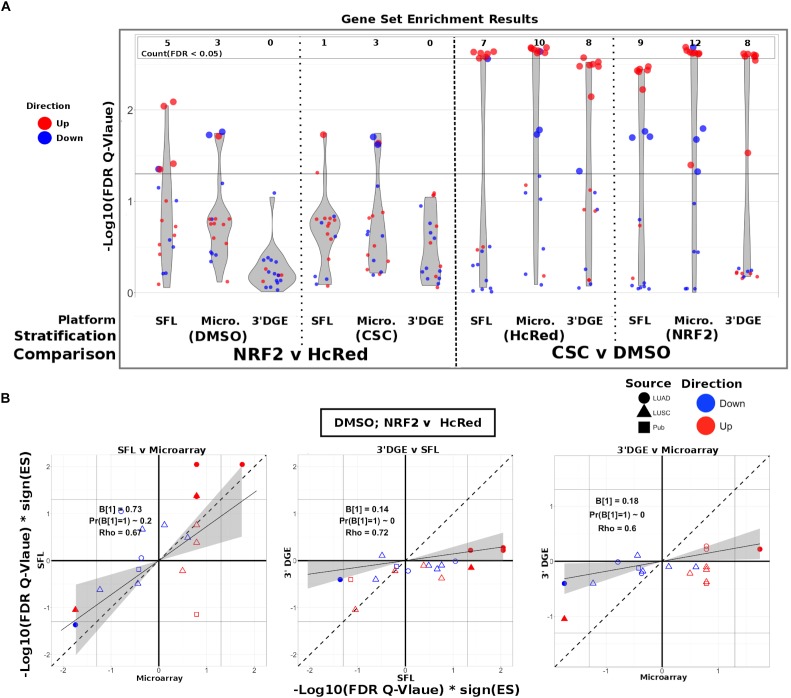
FIGURE 4.
Comparison of gene-set enrichment of smoking and gene mutation signatures across SFL, 3′DGE and microarray. (A) Violin plots of the –Log10(FDR Q-Value) from gene set enrichment analysis of TCGA-derived gene-sets with respect genotypic perturbations (left) and chemical perturbations (right) differential signatures across like samples within SFL, Microarray, and 3′DGE. Each column corresponds to differential signatures comparing genotypic or chemical perturbation groups, stratified by a single chemical or genotypic perturbation group, respectively, e.g., the left-most column shows the enrichment results with respect to the “DMSO-treated; NRF2 vs. HcRed” signature within the samples (stratum) in SFL data. Specific results for TCGA-derived genes sets are shown in Supplementary Figure S7. (B) Comparison of the gene set enrichment results between SFL, microarray and 3′DGE with respect to the “DMSO-treated; NRF2 vs. HcRed” differential signature. Shown are the transformed FDR Q-values of the TCGA-derived gene sets corresponding to mutations of NRF2 and CNA of KEAP1. The | –Log10(FDR Q-Values)| corresponding to the FDR < 0.05 significance thresholds are shown as vertical and horizontal gray lines for the y and x-axes, respectively. Points of gene sets whose enrichment meets this threshold in either of the two platforms are filled in. Colors and shape of points denote direction and source of the gene set, respectively. Additional results for chemical and genotypic perturbation signatures are shown if Supplementary Figure S8.

