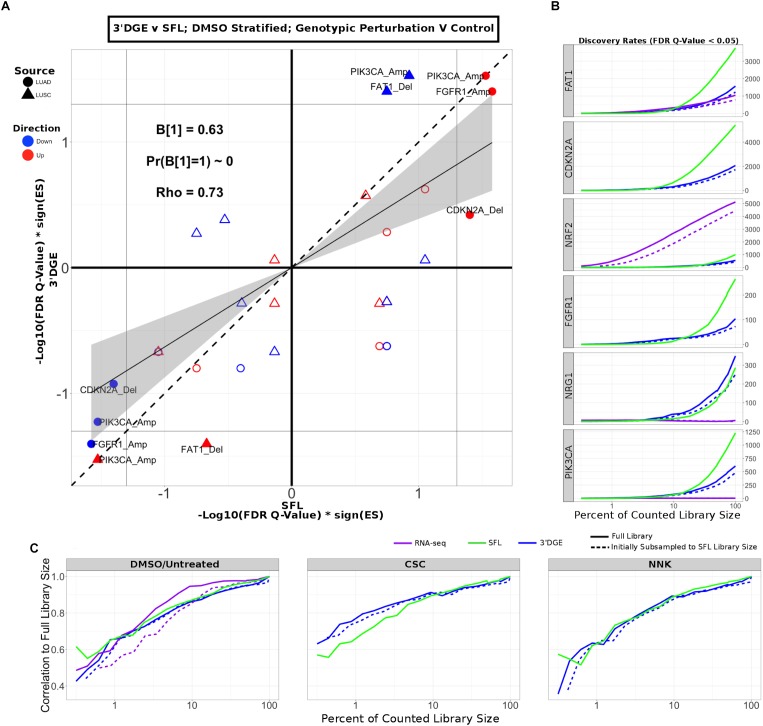
FIGURE 5.
Comparison of gene-set enrichment of gene mutation signatures across SFL and 3′DGE. (A) Comparison of the gene set enrichment results between SFL and 3′DGE with respect to the “DMSO-treated; genotypic perturbation vs. control” differential signatures. Points indicate gene set enrichment against concordant signatures, e.g., PIK3CA mutation and CNA gene sets against the “PIK3CA vs. HcRed” differential signatures. Shown are the transformed FDR Q-values from permutation-based testing by pre-ranked GSEA. | –Log10(FDR Q-Values)| corresponding to the FDR = 0.05 significance thresholds are shown as vertical and horizontal gray lines for the y- and x-axes, respectively. The names of the gene sets whose enrichment meets this threshold in either of the two platforms are shown and their points are filled in. Colors and shape of points denote direction and source of the gene set, respectively. Additional results for CSC, NNK, and BaP stratified genotypic perturbation signatures, as well as comparisons between full coverage RNA-seq and either SFL and 3′DGE are shown in Supplementary Figure S9. (B) Discovery rates for genotypic perturbations across full coverage poly-A RNA-seq, SFL, and 3′DGE, for chemically untreated (full coverage RNA-seq) and DMSO treated (SFL and 3′DGE) samples. Results demonstrate full counted library size, as well as subsampled libraries. (C) Correlation between transformed FDR Q-values from gene set enrichment at different subsamples of each platform and the results from the full counted library size. Shown are the results from genotypic perturbations from untreated (full coverage RNA-seq)/DMSO treated (SFL and 3′DGE), CSC, and NNK chemically treated samples.

