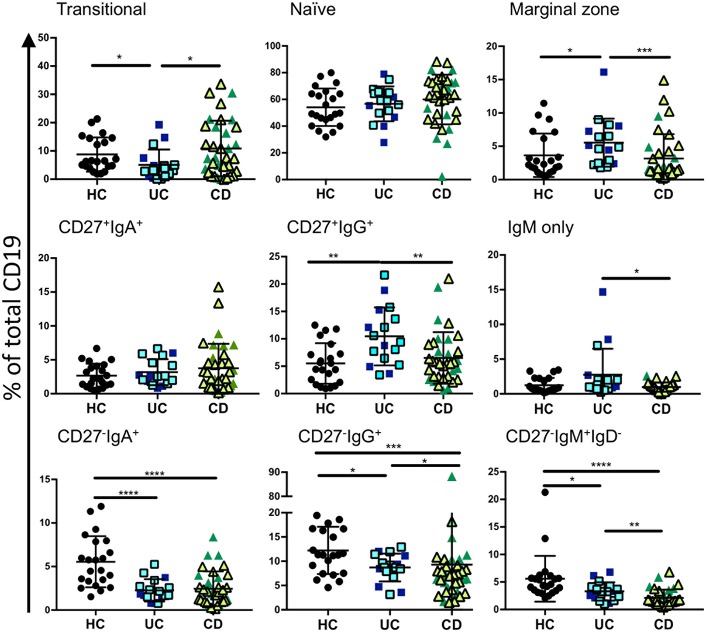
Figure 2.
Analysis of B cell subsets in healthy controls and IBD patients. Peripheral blood mononuclear cells from IBD and HC patients were stained using fluorescent antibodies and gated according to the strategy in Figure 1 and Supplemental Table 4. Data is presented as percentage of total CD19 positive cells from each individual HC (n = 22), UC patient (n = 17), and CD patient (n = 35). Patients with UC in are represented with blue symbols. Symbols that are lighter blue with black borders are patients in remission. Patients with CD in are represented with green symbols. Symbols that are lighter green with black borders are patients in remission. Differences between groups were analyzed by Mann-Whitney U test where p < 0.05 = *, p < 0.01 = **, p < 0.001 = ***, and p < 0.0001 = ****.

