Figure 4.
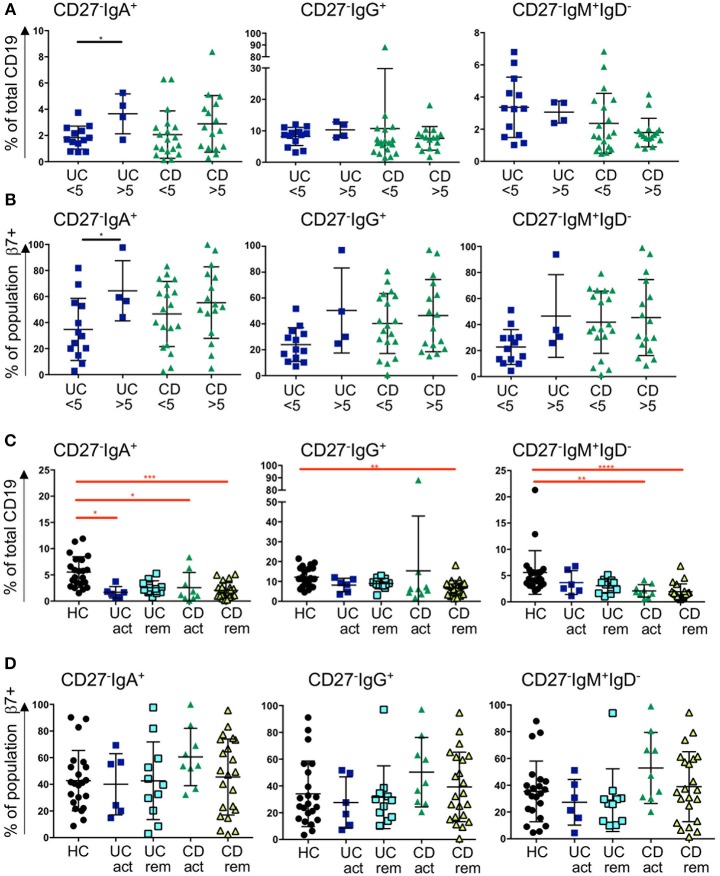
Frequency of blood CD27−IgD− subsets and β7 integrin expression in CD and UC patients stratified according to CRP levels and remission status. Three subsets of CD27−IgD− B cells (CD27−IgA+, CD27−IgG+, and CD27−IgM+) are presented as percentage of CD19 positive cells in (A) and in (B) the percentage of individual populations expressing of β7 integrin. For (A,B), UC < 5 n = 13, UC > 5 n = 4, CD < 5 n = 19, CD > 5 n = 16; for (C,D) HC n = 22, UC active n = 6, UC remission n = 11, CD active n = 9 and CD remission n = 22. Data is analyzed by Mann-Whitney U test (black bars and asterisks) or Kruskal-Wallis ANOVA test (red bars and asterisks) where p < 0.05 = *, p < 0.01 = **, p < 0.001 = *** and p < 0.0001 = ****.

