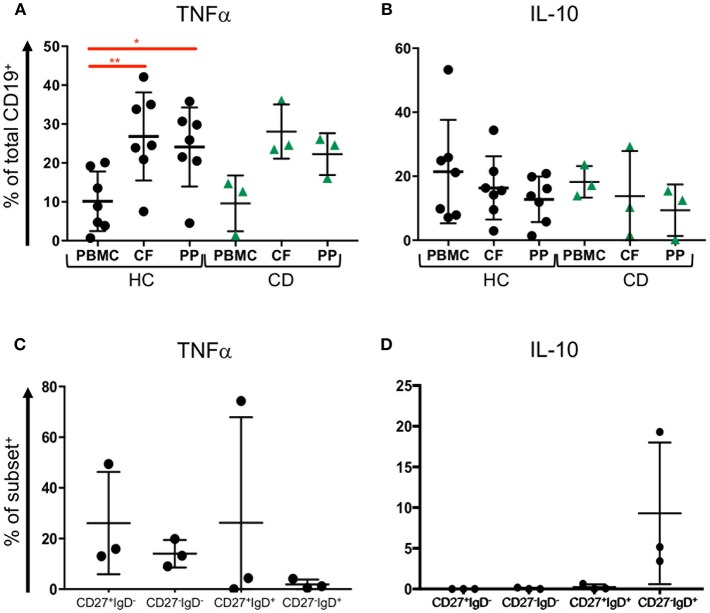
Figure 6.
TNFα and IL-10 expression by blood and tissue B cells. Blood (PBMC) and GALT (CF, colonic follicles; PP, Peyer's patches) samples were obtained from HC (n = 7) and CD patients (n = 3) and isolated CD19+ cells were analyzed for (A) TNFα and (B) IL-10 expression according to the strategy in Supplemental Figure 4. Subsets of B cells were sorted from blood as in Supplemental Figure 3, and expression of (C) TNFα and (D) IL-10 measured. Data was analyzed by Kruskal Wallis ANOVA test, where p < 0.05 = * and p < 0.01 = **.

