
FIGURE 3.
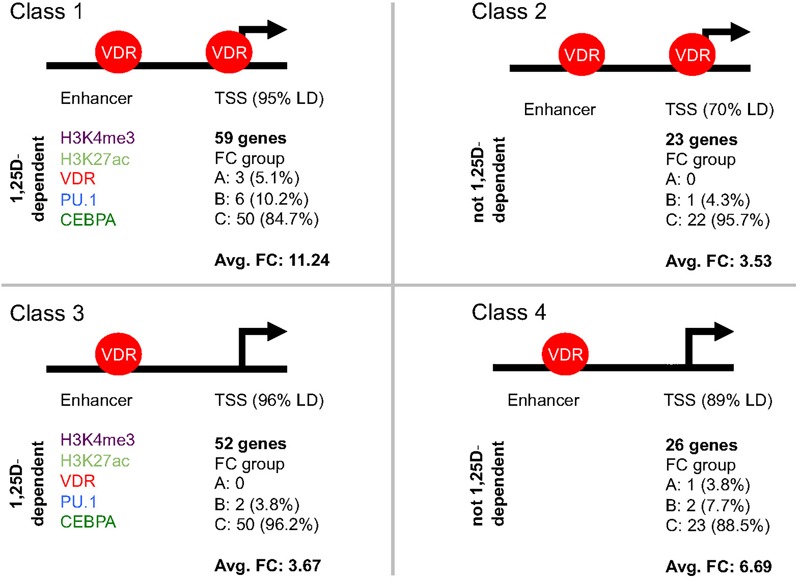
Classification of primary vitamin D target genes. The 160 primary vitamin D target genes that show H3K4me3 marks at their TSS regions can be segregated into four classes. The structure of the genes into TSS and enhancer regions is schematically depicted. Genes of classes 1 and 2 display VDR binding to their TSS regions, while for those of classes 3 and 4 no VDR binding can be detected. The 59 genes of class 1 and the 52 genes of class 3 have significant (p < 0.05) effects of 1,25(OH)2D3 on H3K4me3, H3K27ac, VDR, PU.1 and/or CEBPA binding strength on their enhancer region, while this is not observed for the 23 genes of class 2 and the 26 genes of class 4. In addition, for the respective classes the distribution of the genes of into the fold change (FC) groups A, B and C (Supplementary Figure S2) as well as the average FC is indicated.